Facts
- SARB (South African Reserve Bank) hiked interest rates last week (the repo rate increased to 7% ).
- 75% of South Africa’s refined petroleum product imports originated from the Middle East in 2024.
- The USDZAR exchange rate is currently trading at 16.2360 , near a key support level ( 16.1400 ) established by the April lows.
- The price is currently trading well below three major moving averages: EMA 50 (16.4679) , EMA 100 (16.5195) , and EMA 150 (16.6072) .
- The RSI (14) indicator stands at 41.3 .
Recommendation
- Position: Long (BUY) on USDZAR at market price ( 16.2360 ).
- Take Profit (TP): 16.3980 (TP1), 16.4720 (TP2)
- Stop Loss (SL): 16.0500
Chart: USDZAR (07.01 – 01.06)
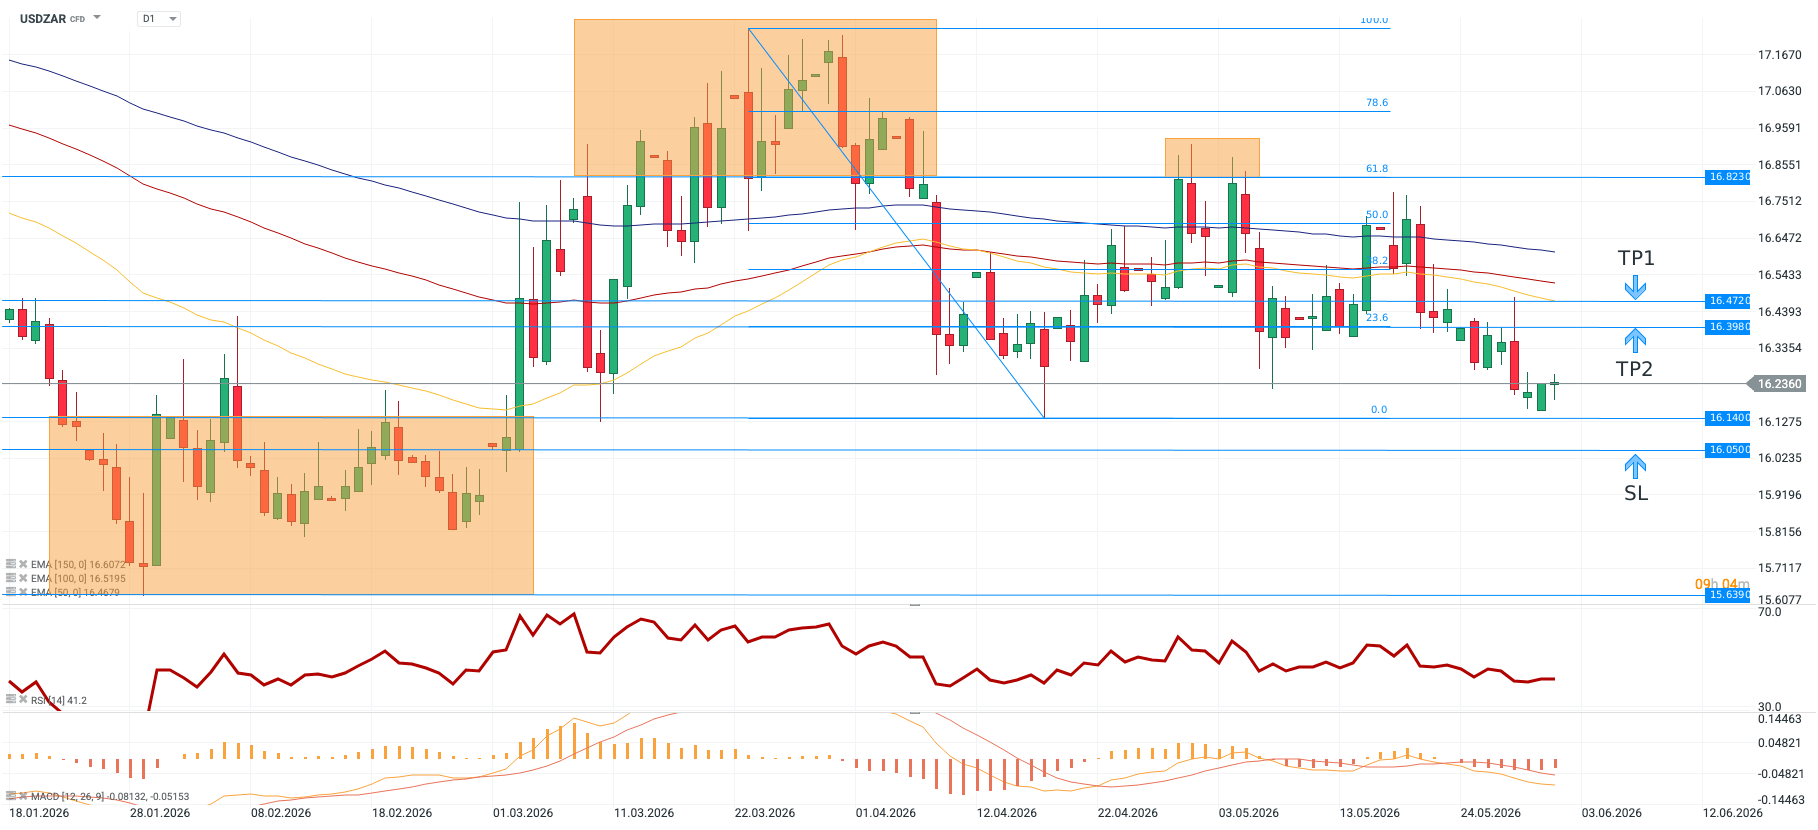
Source: xStation, 01.06.2026 (14:55)
Opinion
Following its weakening in April, the South African rand (ZAR) returned to investors’ favor, appreciating by 2.8% against the US dollar in May. During this period, the only currencies that performed better were those we do not regularly analyze (RUB, ILS, CDF). This appreciation was largely driven by an improvement in global market sentiment triggered by headlines suggesting progress in negotiation talks between the US and Iran. The rand remains one of the currencies most heavily exposed to prolonged disruptions in the Strait of Hormuz. In recent years, South Africa has been plagued by electricity supply issues, frequently burning through millions of liters of diesel fuel to keep the power grid afloat.
Given that 75% of the country’s refined petroleum is imported from the Middle East, May’s rising optimism regarding the Tehran-Washington negotiations supported the currency. Recently, however, there has been a lack of evidence of further progress in these talks, which could begin to weigh heavily on the rand. The SARB provided some support for the rand in the final hours of May trading by delivering its first interest rate hike in three years. However, despite relatively hawkish signals (a 50 bps hike was openly considered), the market response was muted.
Investors are currently not pricing in another upward move anytime soon. This stands in sharp contrast to the United States, where an interest rate hike before the end of the year is priced in at approximately 65%. If the hawkish wing of the committee reasserts itself during the rapidly approaching FOMC meeting (16.06), investors may begin to look more favorably upon the US dollar. It is also worth noting that the exchange rate has reached a key psychological support level around 16.1400 , which historically (including early March and mid-April) acted as a significant resistance point.
Additionally, the RSI (14) indicator has neared the oversold threshold (around the 40-point mark), which has historically signaled the exhaustion of downward momentum. Defending these levels opens the door for a bullish reversal scenario. In this setup, the initial targets for buyers become the resistance levels at TP1 (16.3980) and TP2 (16.4720) , which align with the nearest Fibonacci retracement and the EMA 50. The protection level ( SL ) has been set below the 0.0 Fibonacci retracement level, i.e., the April low of the exchange rate.