Global Markets
S&P 500 — US Large Cap Index
NASDAQ 100 — Tech Growth Index
Dow Jones — Industrial Average
FTSE 100 — UK Blue Chips
Euro Stoxx 50 — Eurozone Leaders
DAX 40 — German Equities
CAC 40 — French Market Index
Nikkei 225 — Japan Benchmark
Hang Seng — Hong Kong Index
Shanghai Composite — China Mainland
ASX 200 — Australian Market
TSX Composite — Canada Index
Nifty 50 — India Large Cap
STI Index — Singapore Market
KOSPI — South Korea Index
Bovespa — Brazil Equities
JSE Top 40 — South Africa Index
IPC Index — Mexico Market
MarketsTechnical Analysis

Bitcoin slides 3% falling to the lowest level since 13 April

Bitcoin is retreating today to just under $72,000, and on the daily timeframe we can see that the RSI has already fallen to a level close to “oversold” territory at 32.6. On the other hand, historical market bottoms have typically occurred at significantly lower RSI readings than the current one, suggesting that if this is indeed another leg lower, it may still be too early to expect the downtrend to stabilize.

  • On-chain data indicates that whales have paused their Bitcoin accumulation, a pattern that has historically preceded periods of weakness during crypto bear markets.
  • Based on the historical halving cycle, a potential Bitcoin price bottom could emerge in early autumn 2026, while spot demand still lags.
  • Seasonally, the summer period tends to be weak for the cryptocurrency market, with Bitcoin declining today despite record gains in global equity markets.
  • Precious metals are also under pressure alongside cryptocurrencies, as markets adjust to expectations of slightly more hawkish inflation and central bank policies compared with the environment seen at the turn of 2025 and 2026.

Bitcoin (D1 timeframe)

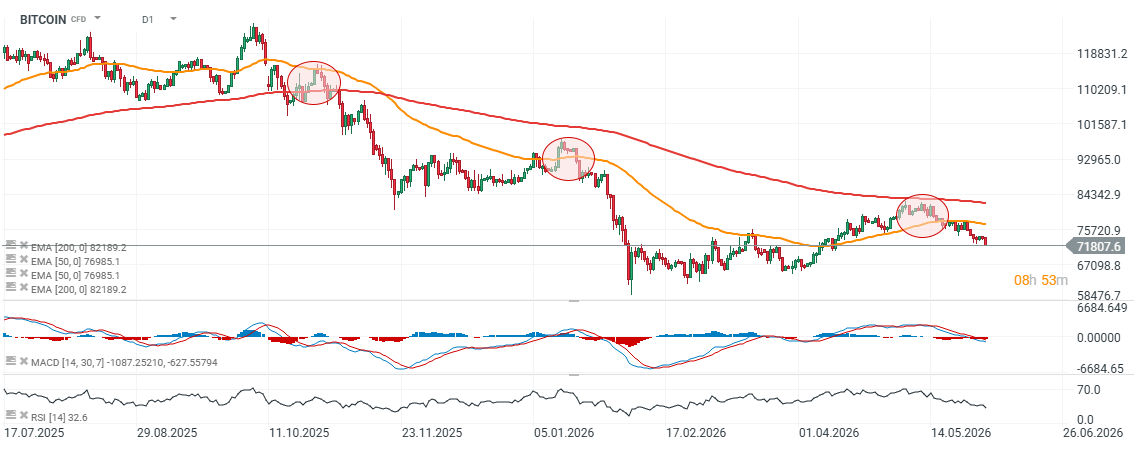
Source: xStation5 Looking at the hourly chart, Bitcoin remains within a downward price channel and is currently trading roughly in the middle of that range. Key support levels are located near $67,000 and in the $60,000–61,000 area.
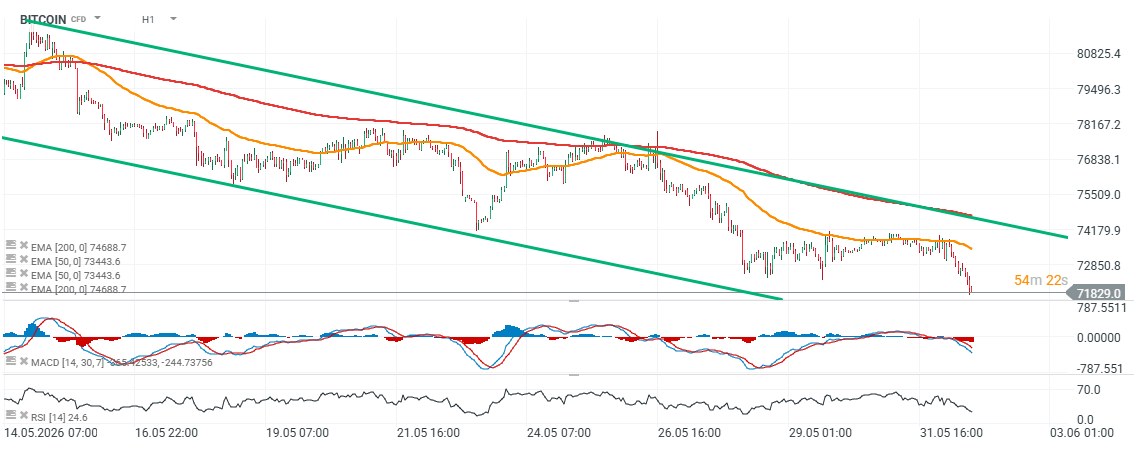
Source: xStation5

Octalas AI
Octalas Logo

Profit

Everyone's racing to cut costs. We're racing to create profit.

Start Selling through Service

Free for 14 days · No credit card required
Profit Through AI

Related Articles

Leave a Reply

Your email address will not be published. Required fields are marked *

Back to top button