
Brent crude (OIL) is up nearly 3% today, reaching $93.86 per barrel, with a daily trading range of $92.52 to $94.20. The main catalyst for the gains is the escalation of geopolitical tensions in the Strait of Hormuz—mutual strikes between the U.S. and Iran, as well as reports of Iranian President Pezeshkian’s resignation, are shaking up the commodities market.
Fundamental Environment
Geopolitics is overshadowing oil. The fourth month of the U.S.-Iran conflict has seen no breakthrough—the U.S. Navy is escorting only about 70 ships per week through the Strait of Hormuz, compared to the pre-war average of over 100 per day. Paradoxically, throughout May, oil prices recorded its largest monthly decline in a year (nearly -17%) , as markets priced in hopes for a deal—today we are seeing a rebound following disillusionment and new military reports.
Two pieces of news that particularly fueled expectations of rising oil prices today were reports of attacks on the Ali Al Salem Airbase in Kuwait and alleged rumors of the Iranian president’s resignation. In a letter sent on Sunday, Pezeshkian emphasized that the president and the government had effectively been excluded from the country’s most important and critical decision-making processes, and that the resulting power vacuum had enabled factions within the Islamic Revolutionary Guard Corps to seize control of the state’s actual power.
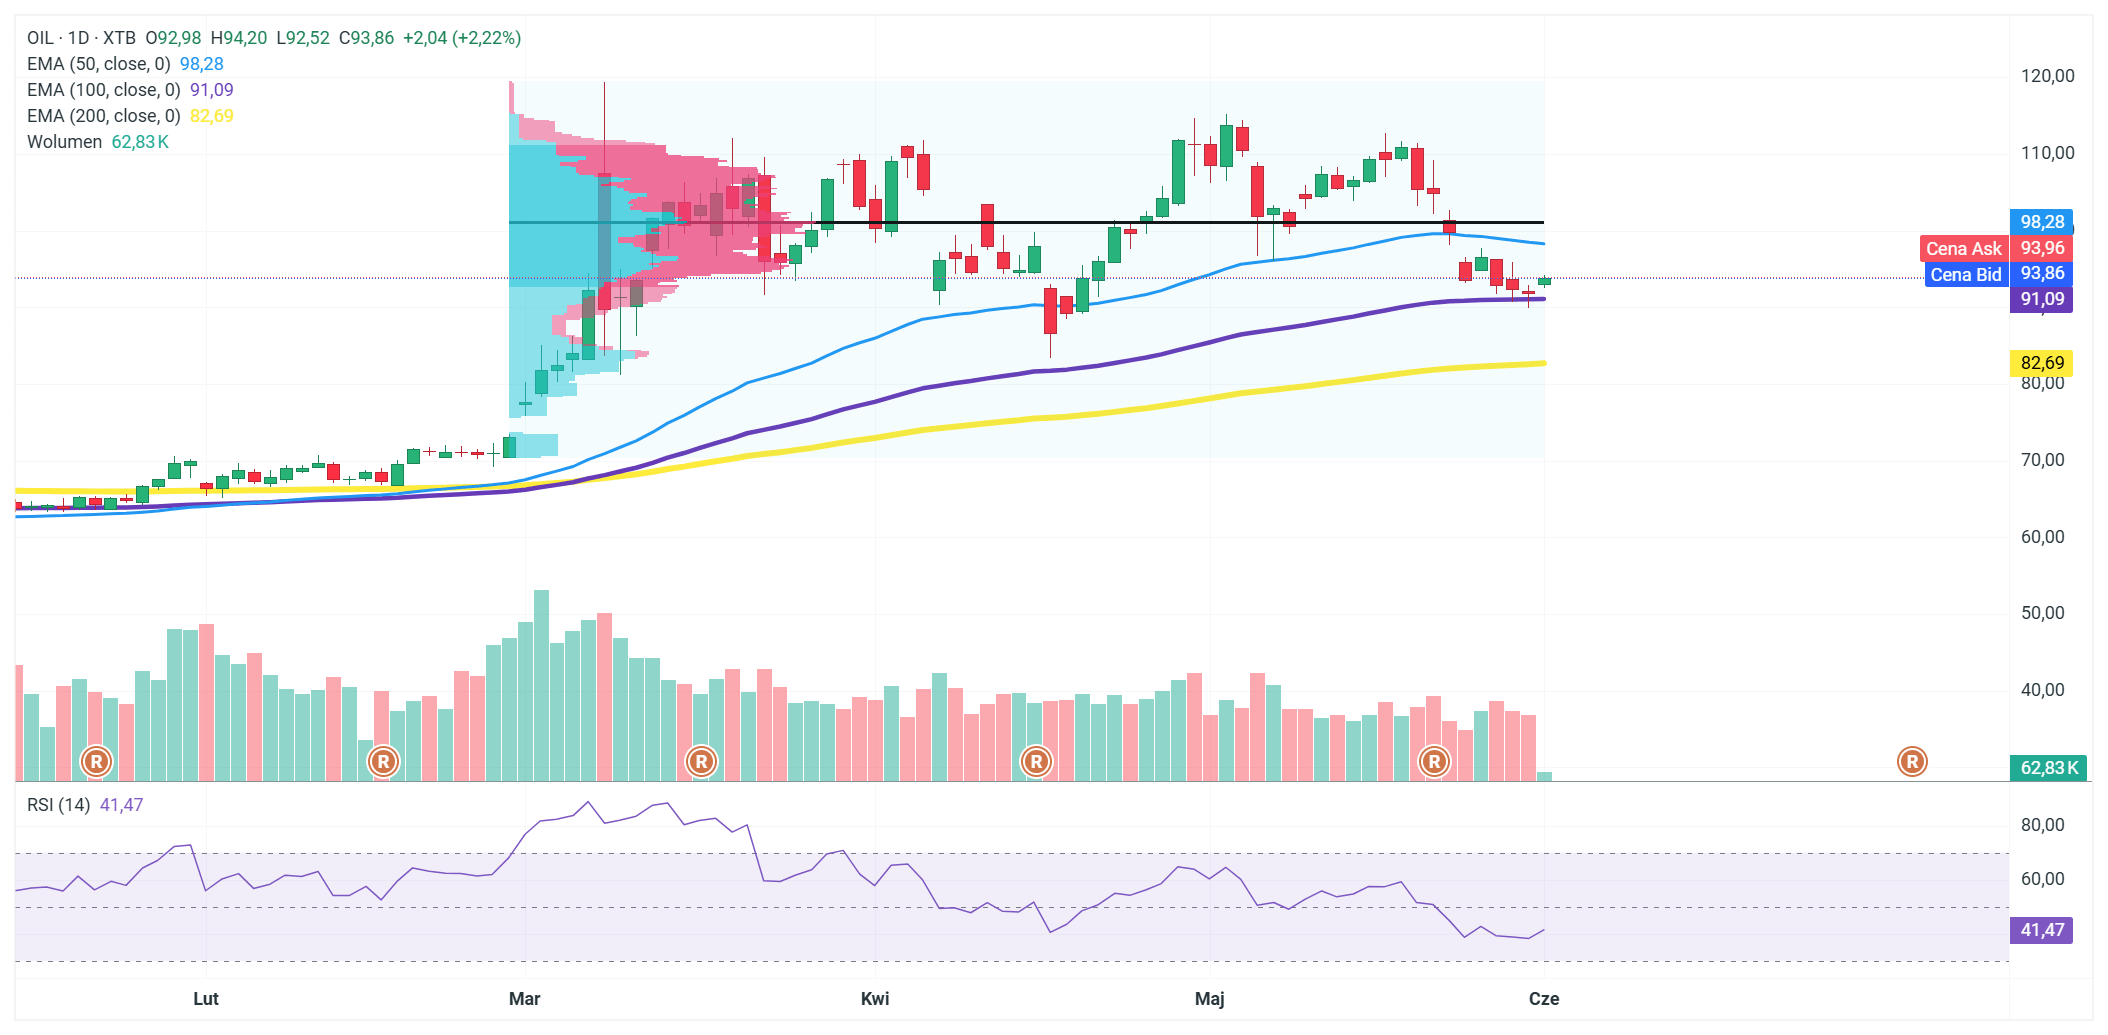
Oil has been trading below the 50-day EMA (98.28) for weeks, which immediately sets the context—sellers are dominating in the medium term, and every rally hits this level like a wall. The decline from the March highs around $110 was gradual until the price reached the zone where it currently stands, right at the EMA100 at 91.09 — and this is the key point on the chart today, as the EMA100 has repeatedly cushioned oversold conditions over the past few months and is now being tested from above once again.
The RSI at 41.47 completes this picture—the indicator is not yet at deeply oversold levels, which historically have generated strong rebounds, but it is approaching the zone where buyers begin to step in, making a reaction at the EMA100 technically justified. The volume profile shows that the highest concentration of trades from previous months falls within the $100–$105 range, meaning that a return to this area would require not only breaking above the EMA50 but also breaking through a dense zone of historical orders—and that is where the real test for the bulls lies.
Source: xStation