XAG/USD holds steady above $33.00 mark, seems poised to climb further
- Silver attracts some dip-buyers at the start of a new week, though it lacks bullish conviction.
- The setup favors bullish traders and supports prospects for an eventual break to the upside.
- Dips below the $33.00 mark could be seen as a buying opportunity and remain cushioned.
Silver (XAG/USD) edges higher at the start of a new week and retakes the $33.00 mark during the Asian session, reversing a part of Friday’s losses. The intraday uptick, however, lacks bullish conviction, warranting some caution before positioning for any meaningful appreciating move.
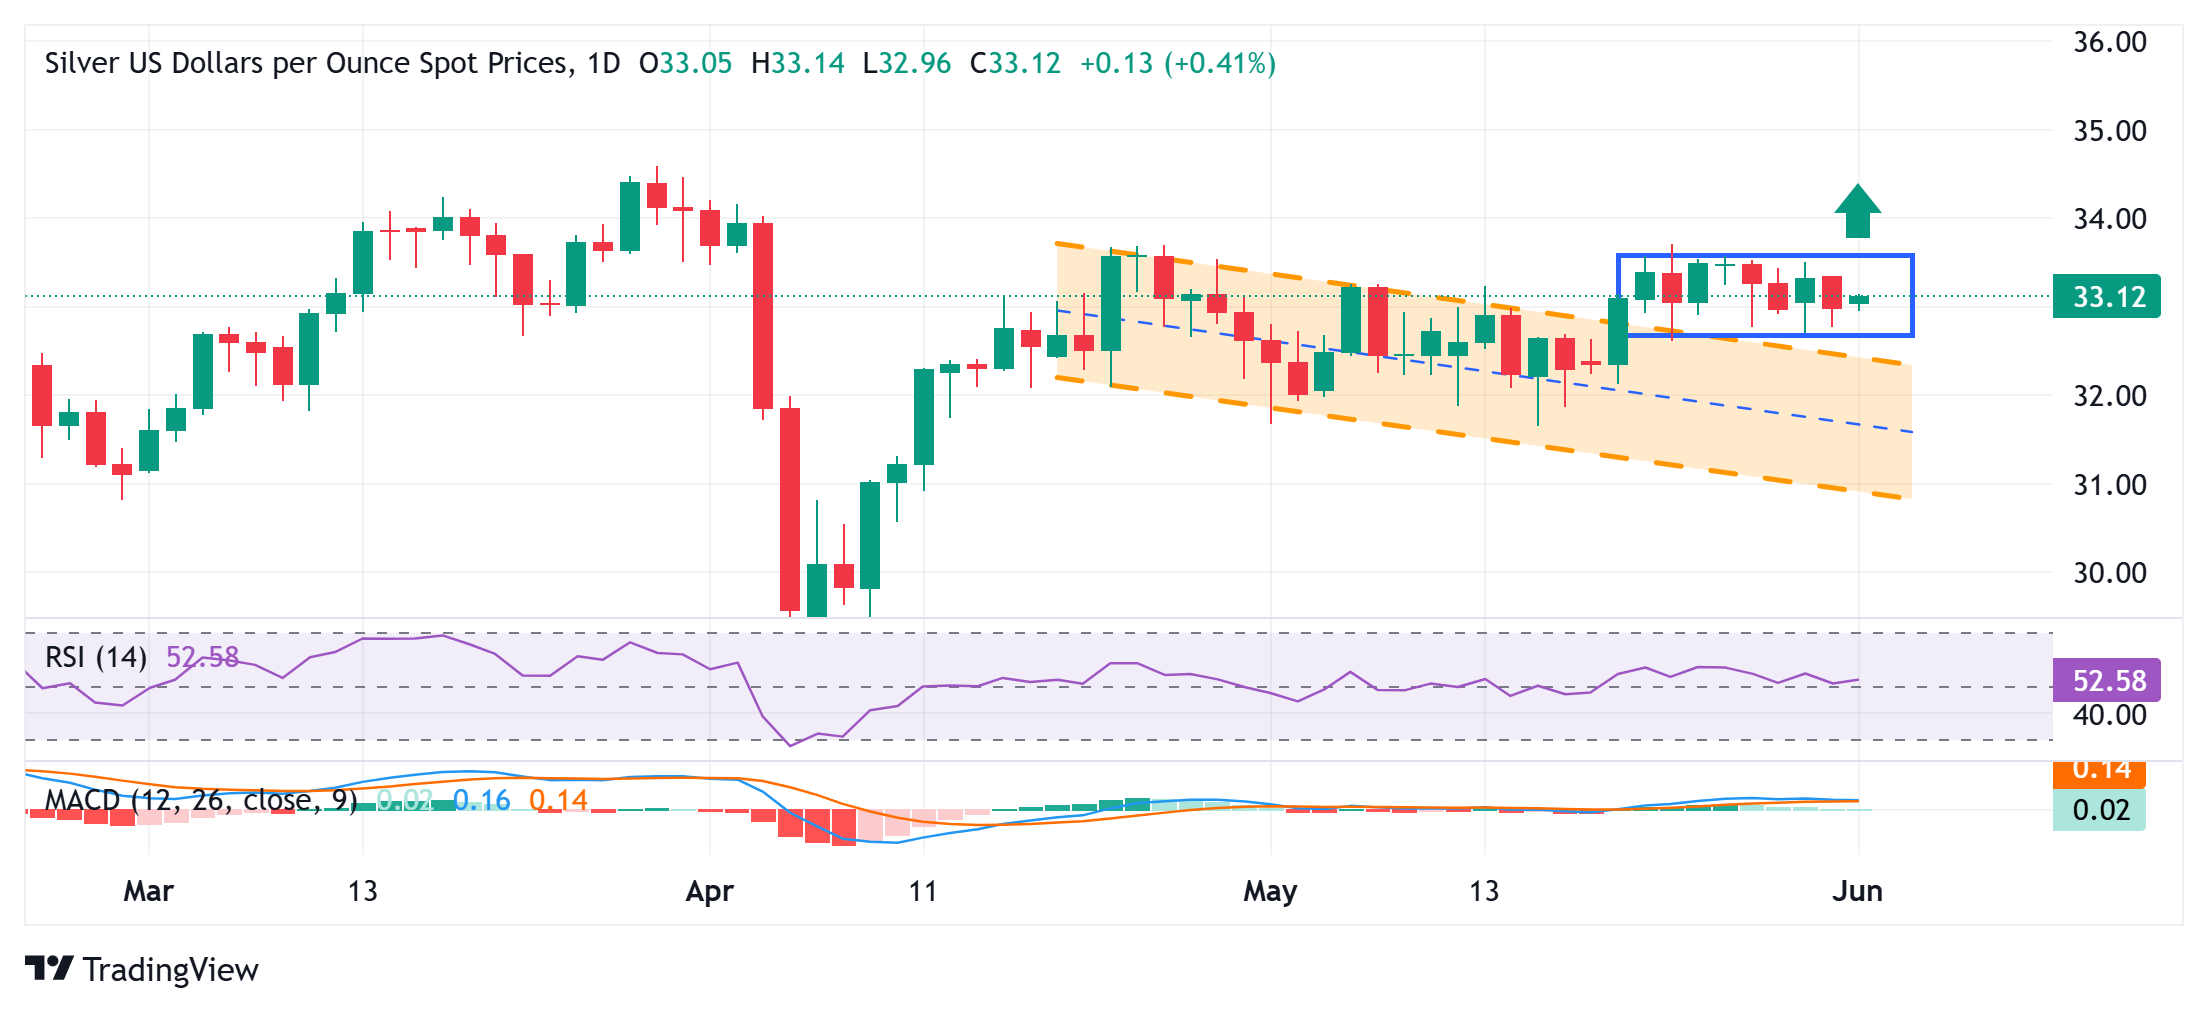
Looking at the broader picture, the XAG/USD has been oscillating in a familiar range over the past two weeks or so, forming a rectangle on short-term charts. Against the backdrop of the recent breakout through a descending channel, this might still be categorized as a bullish consolidation phase. Moreover, slightly positive technical indicators on the daily chart – though they have been struggling to gain any meaningful traction – back the case for an eventual breakout to the upside.
In the meantime, any subsequent move higher might continue to face strong resistance near the $33.50 supply zone. A sustained strength beyond will reaffirm the constructive outlook and lift the XAG/USD beyond the $33.65-70 hurdle, or the highest level since early April touched last Thursday, towards the $34.00 round-figure mark. The momentum could extend further and allow the white metal to retest the year-to-date high, around the $34.55-$34.60 zone touched in March.
On the flip side, the $32.75-32.70 area, or the lower boundary of the aforementioned trading range, should continue to offer immediate support to the XAG/USD. A convincing break below might expose the 100-day Simple Moving Average (SMA) support, currently pegged just above the $32.00 mark. Some follow-through selling could drag the commodity further toward the $31.40 support, which if broken decisively might shift the near-term bias in favor of bearish traders.
Silver daily chart