Germany’s final Harmonized Index of Consumer Prices for May remains at 2.7% YoY: What it means for EUR/USD?

Germany’s final Harmonized Index of Consumer Prices (HICP) data for May has arrived at 2.7% Year-on-Year (YoY), as the preliminary data showed. The inflation data cooled down from 2.9% in April. On a monthly basis, it is confirmed that the German HICP growth declined by 0.1%.
There is a slight recovery move in the EUR/USD data, following the German final HICP data release; however, it appears that the move has come due to a slight correction in the US Dollar (USD). Still, the major currency pair is down 0.15% to near 1.1560.
Euro Price Today
The table below shows the percentage change of Euro (EUR) against listed major currencies today. Euro was the weakest against the US Dollar.
| USD | EUR | GBP | JPY | CAD | AUD | NZD | CHF | |
|---|---|---|---|---|---|---|---|---|
| USD | 0.10% | 0.06% | 0.19% | 0.06% | 0.20% | 0.29% | 0.13% | |
| EUR | -0.10% | -0.05% | 0.09% | -0.04% | 0.11% | 0.19% | 0.02% | |
| GBP | -0.06% | 0.05% | 0.15% | 0.01% | 0.12% | 0.23% | 0.08% | |
| JPY | -0.19% | -0.09% | -0.15% | -0.15% | -0.01% | 0.08% | -0.08% | |
| CAD | -0.06% | 0.04% | -0.01% | 0.15% | 0.14% | 0.22% | 0.07% | |
| AUD | -0.20% | -0.11% | -0.12% | 0.01% | -0.14% | 0.07% | -0.08% | |
| NZD | -0.29% | -0.19% | -0.23% | -0.08% | -0.22% | -0.07% | -0.14% | |
| CHF | -0.13% | -0.02% | -0.08% | 0.08% | -0.07% | 0.08% | 0.14% |
The heat map shows percentage changes of major currencies against each other. The base currency is picked from the left column, while the quote currency is picked from the top row. For example, if you pick the Euro from the left column and move along the horizontal line to the US Dollar, the percentage change displayed in the box will represent EUR (base)/USD (quote).
What do Germany’s final HICP data mean for EUR/USD?
The impact of Germany’s final HICP data remains little on EUR/USD, unless there is a dramatic deviation. The major trigger for the major currency pair remains preliminary readings.
Meanwhile, the European Central Bank’s (ECB) monetary policy announcement on Thursday, in which it raised the Deposit Facility rate by 25 basis points (bps) to 2.25%, signaled that policymakers remained highly concerned about upside inflation risks due to elevated energy prices in the wake of Middle East conflicts.
ECB President Christine Lagarde said in the press conference, post the monetary policy announcement, “Short-term inflation expectations have risen,” and the central bank will “monitor size, persistence of energy price increase”.
Technical Analysis:
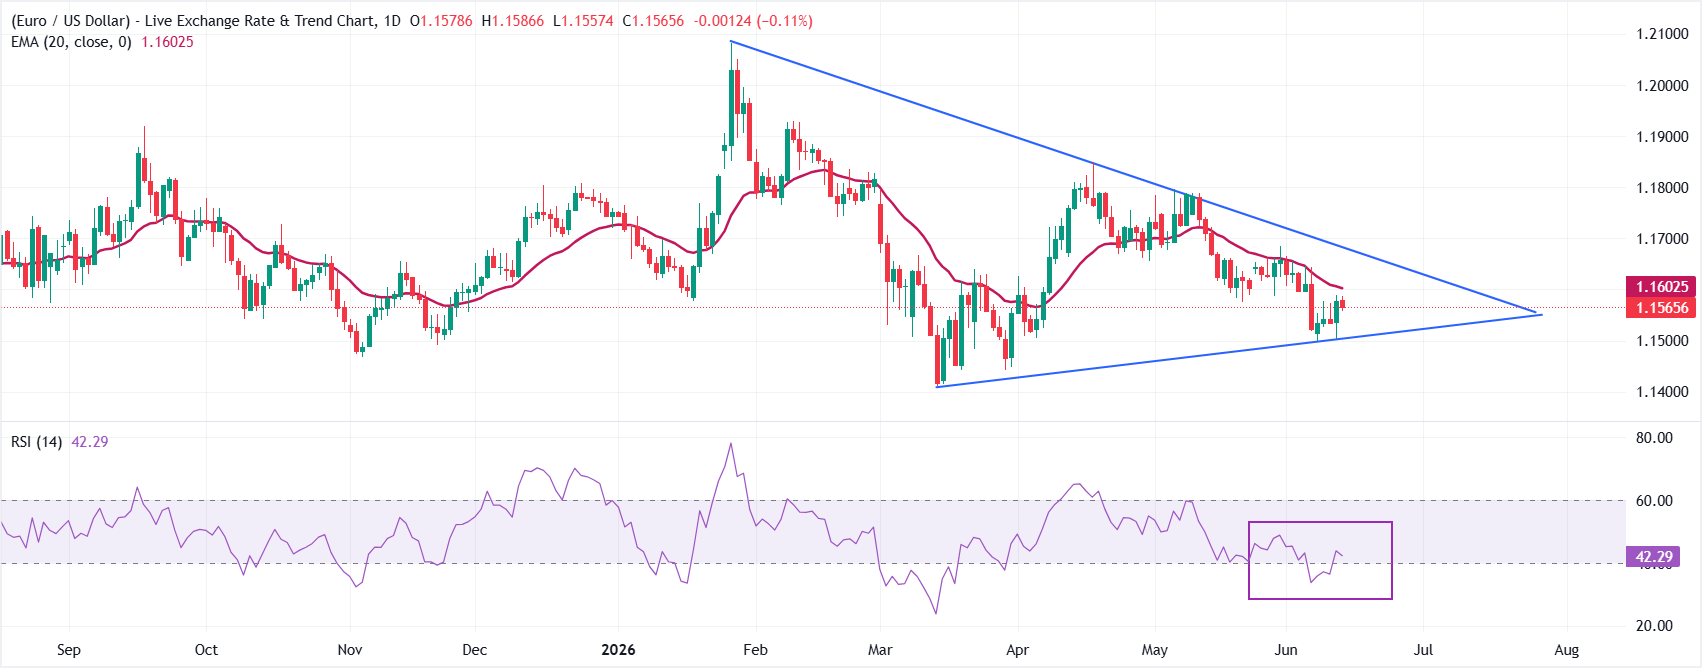
EUR/USD trades lower at around 1.1560, keeping a bearish bias as spot holds beneath the 20-period Exponential Moving Average (EMA) at 1.1603 and the broader downtrend resistance line near 1.1687. The pair is still riding an underlying ascending support structure from 1.1503, but the latest Relative Strength Index (14) reading around 42 suggests sellers retain the near-term initiative while any rebounds are likely to struggle against overhead supply.
On the topside, initial resistance is located at the 20-period EMA around 1.1603, with the descending trend-line resistance at 1.1687 acting as the next barrier if buyers manage a clearer bounce. On the downside, the first key support emerges at the rising trend-line break level near 1.1503; a daily close below this floor would expose it to the March 13 low at 1.1411.