S&P 500 — US Large Cap Index
 FTSE 100 — UK Blue Chips
 Euro Stoxx 50 — Eurozone Leaders
 DAX 40 — German Equities
 CAC 40 — French Market Index
 Nikkei 225 — Japan Benchmark
 Hang Seng — Hong Kong Index
 Shanghai Composite — China Mainland
 ASX 200 — Australian Market
 TSX Composite — Canada Index
 Nifty 50 — India Large Cap
 STI Index — Singapore Market
 KOSPI — South Korea Index
 Bovespa — Brazil Equities
 JSE Top 40 — South Africa Index
 IPC Index — Mexico Market
Bank of America Disappoints: A $1.2 Billion Fine and Weaker Trading Weigh on Earnings


Key takeaways
- The second-largest U.S. bank is paying the price for its negligence in money laundering — its stock is down more than 4%
Bank of America (BAC.US) reported a sharp decline in third-quarter earnings, weighed down by a one-time regulatory fine of $1.2 billion and weaker trading results. Net income totaled $6.9 billion ($0.91 per share) , compared with $8.3 billion ($1.04) a year earlier. Revenue reached $30.0 billion and fell short of the forecast of $30.7 billion.
After adjusting for a one-time charge, adjusted EPS came in at $1.08—and it was this charge that reduced net income by 17 cents per share.
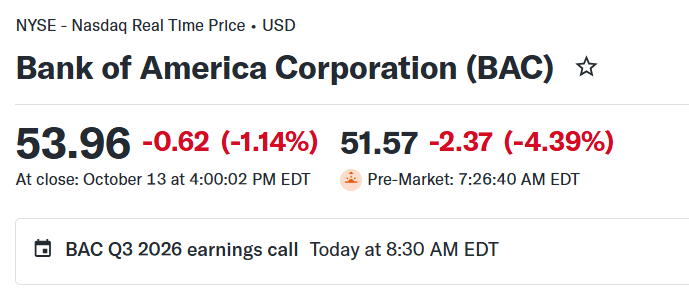
The company’s stock is down more than 4% ahead of today’s opening on Wall Street. Source: Yahoo Finance The biggest negative surprise turned out to be the fine imposed by the Treasury Department, which was disclosed the day before the results were released. The bank will pay over $1.21 billion for widespread failures in detecting money laundering and sanctions violations—specifically, for failing to report suspicious transactions totaling more than $5 billion. This is the third-highest fine in U.S. Treasury history, and the bank is subject to a consent order requiring it to cooperate with an external entity in monitoring transactions. The market interprets this as a sign of growing regulatory pressure and raises questions about the quality of controls under CEO Brian Moynihan. The second disappointment was trading . Revenue from trading activities fell 5% to $5.1 billion, well below the expected $5.41 billion. Both segments underperformed: FICC (fixed income, currencies, and commodities) plummeted by 11–17% to $2.55 billion (consensus: $2.86 billion), while equities fell by 4.5% to $2.51 billion (expected: $2.63 billion). This contrasts with strong equity results at Goldman Sachs and JPMorgan, as well as Citigroup’s best bond quarter in a decade. BofA, with a limited presence in transactions related to the AI boom, missed out on a significant portion of the heightened trading activity. However, not everything went poorly. Investment banking , although fees fell by 11% to $1.8 billion, beat the consensus estimate ($1.77 billion), driven by debt underwriting. A strong point was net interest income (NII) , which rose 8% to $16.45 billion, exceeding forecasts thanks to high interest rates. Credit quality also came as a positive surprise—loan loss reserves totaled $1.27 billion versus the expected $1.49 billion, signaling that U.S. consumers are holding up surprisingly well despite high energy prices and inflation above target.
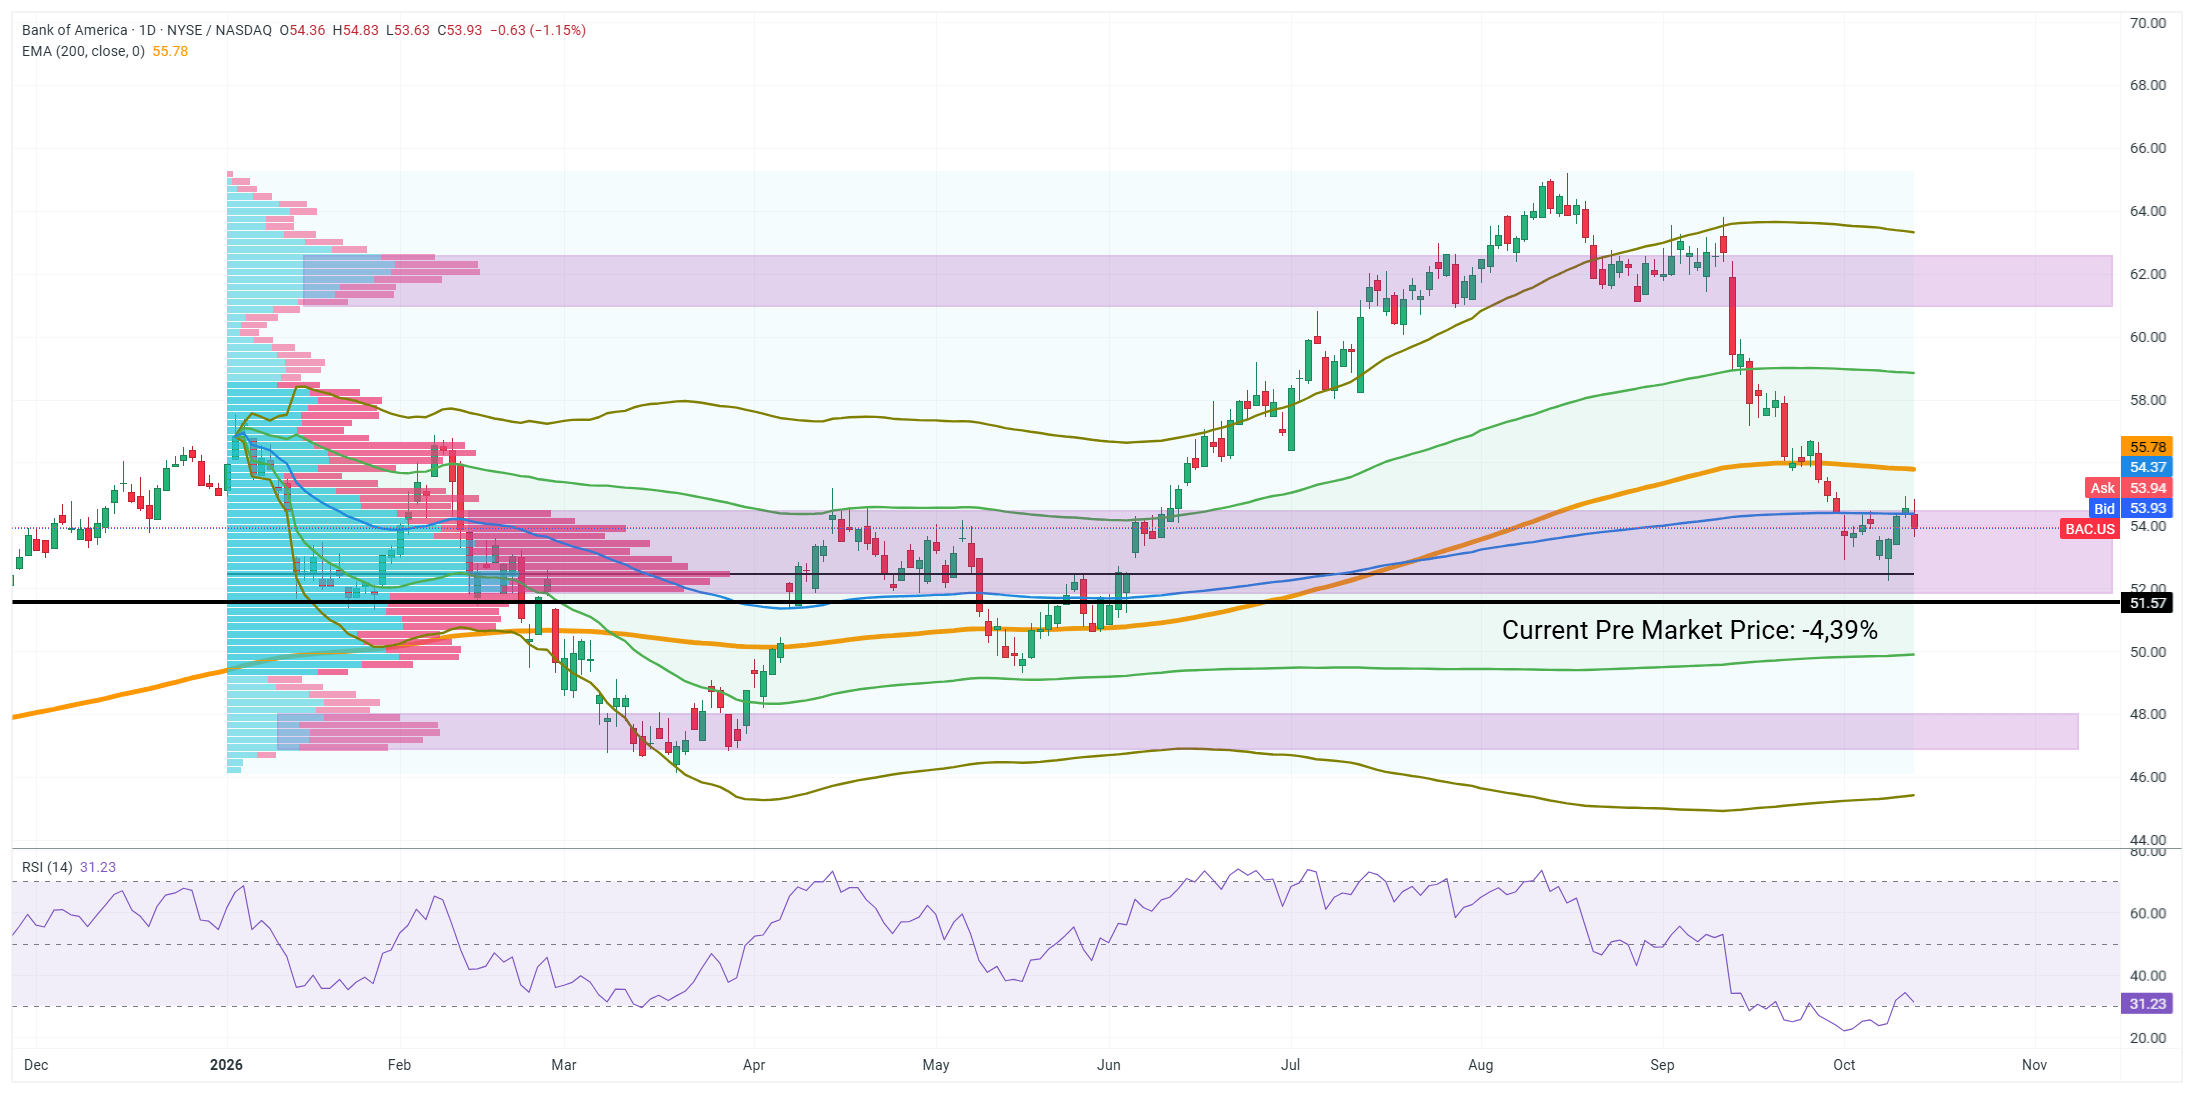
If the stock opens at levels similar to current pre-market indications, there will be a breakout of an important volume cluster, which effectively serves as the main control point for the bank’s stock price this year. A break below this level, followed by a series of daily closes lower, could theoretically set the stage for further downside moves toward the $48 per share range. On the other hand, if the declines are quickly halted at an important support level, the 200-day EMA—which has not been tested since September 28—may remain a key resistance level (orange curve). Source: XTB