S&P 500 — US Large Cap Index
 FTSE 100 — UK Blue Chips
 Euro Stoxx 50 — Eurozone Leaders
 DAX 40 — German Equities
 CAC 40 — French Market Index
 Nikkei 225 — Japan Benchmark
 Hang Seng — Hong Kong Index
 Shanghai Composite — China Mainland
 ASX 200 — Australian Market
 TSX Composite — Canada Index
 Nifty 50 — India Large Cap
 STI Index — Singapore Market
 KOSPI — South Korea Index
 Bovespa — Brazil Equities
 JSE Top 40 — South Africa Index
 IPC Index — Mexico Market

Boeing Plunged 10% After Earnings Report and Delivery Target Cut. One of the Worst Days in the Stock’s History


Boeing (BA.US) shares plummeted by nearly 10% on Tuesday, marking one of their worst trading sessions since the pandemic began, after the aerospace company lowered its delivery target and reported a larger-than-expected loss per share in the third quarter.
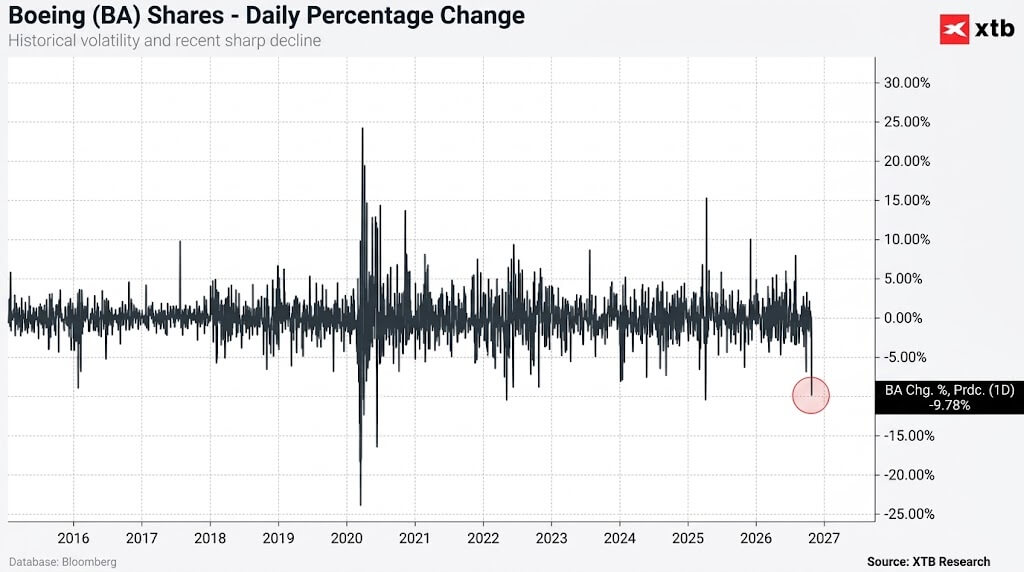
Shares fell by 9.78 per cent, dropping to around US$170. As the table of daily percentage changes shows, falls of this magnitude – apart from the turmoil of 2020 – have occurred only a few times over the past decade for Boeing shares. Source: XTB The company reported an adjusted loss per share of 34 cents, compared with a market-expected loss of 21 cents. Revenue rose by around 4 per cent year-on-year to US$24.19 billion, slightly above the consensus estimate of US$23.84 billion. The disappointment in earnings was driven by the commercial aircraft segment, which recorded an operating loss of US$697 million with a negative margin of 6.5 per cent. By comparison, the defence and aerospace division achieved a margin of 6.2 per cent, whilst global services recorded a margin of 18.3 per cent.
However, the key factor behind the share price fall was the reduction in the delivery target, which undermined investors’ confidence in the pace at which the company would return to normal production capacity. Production of the 737 model is targeting 47 units per month, whilst that of the 787 remains stable at 8 aircraft. The report also contained some brighter spots. Operating cash flow rose by a third to US$1.5 billion, free cash flow stood at a positive US$464 million, and the 737-7 model received a revised type certificate from the FAA, with the 737-10 following suit in October. Boeing was also selected by the US Navy to design and supply a new-generation fighter, and its total order book stands at US$745 billion.
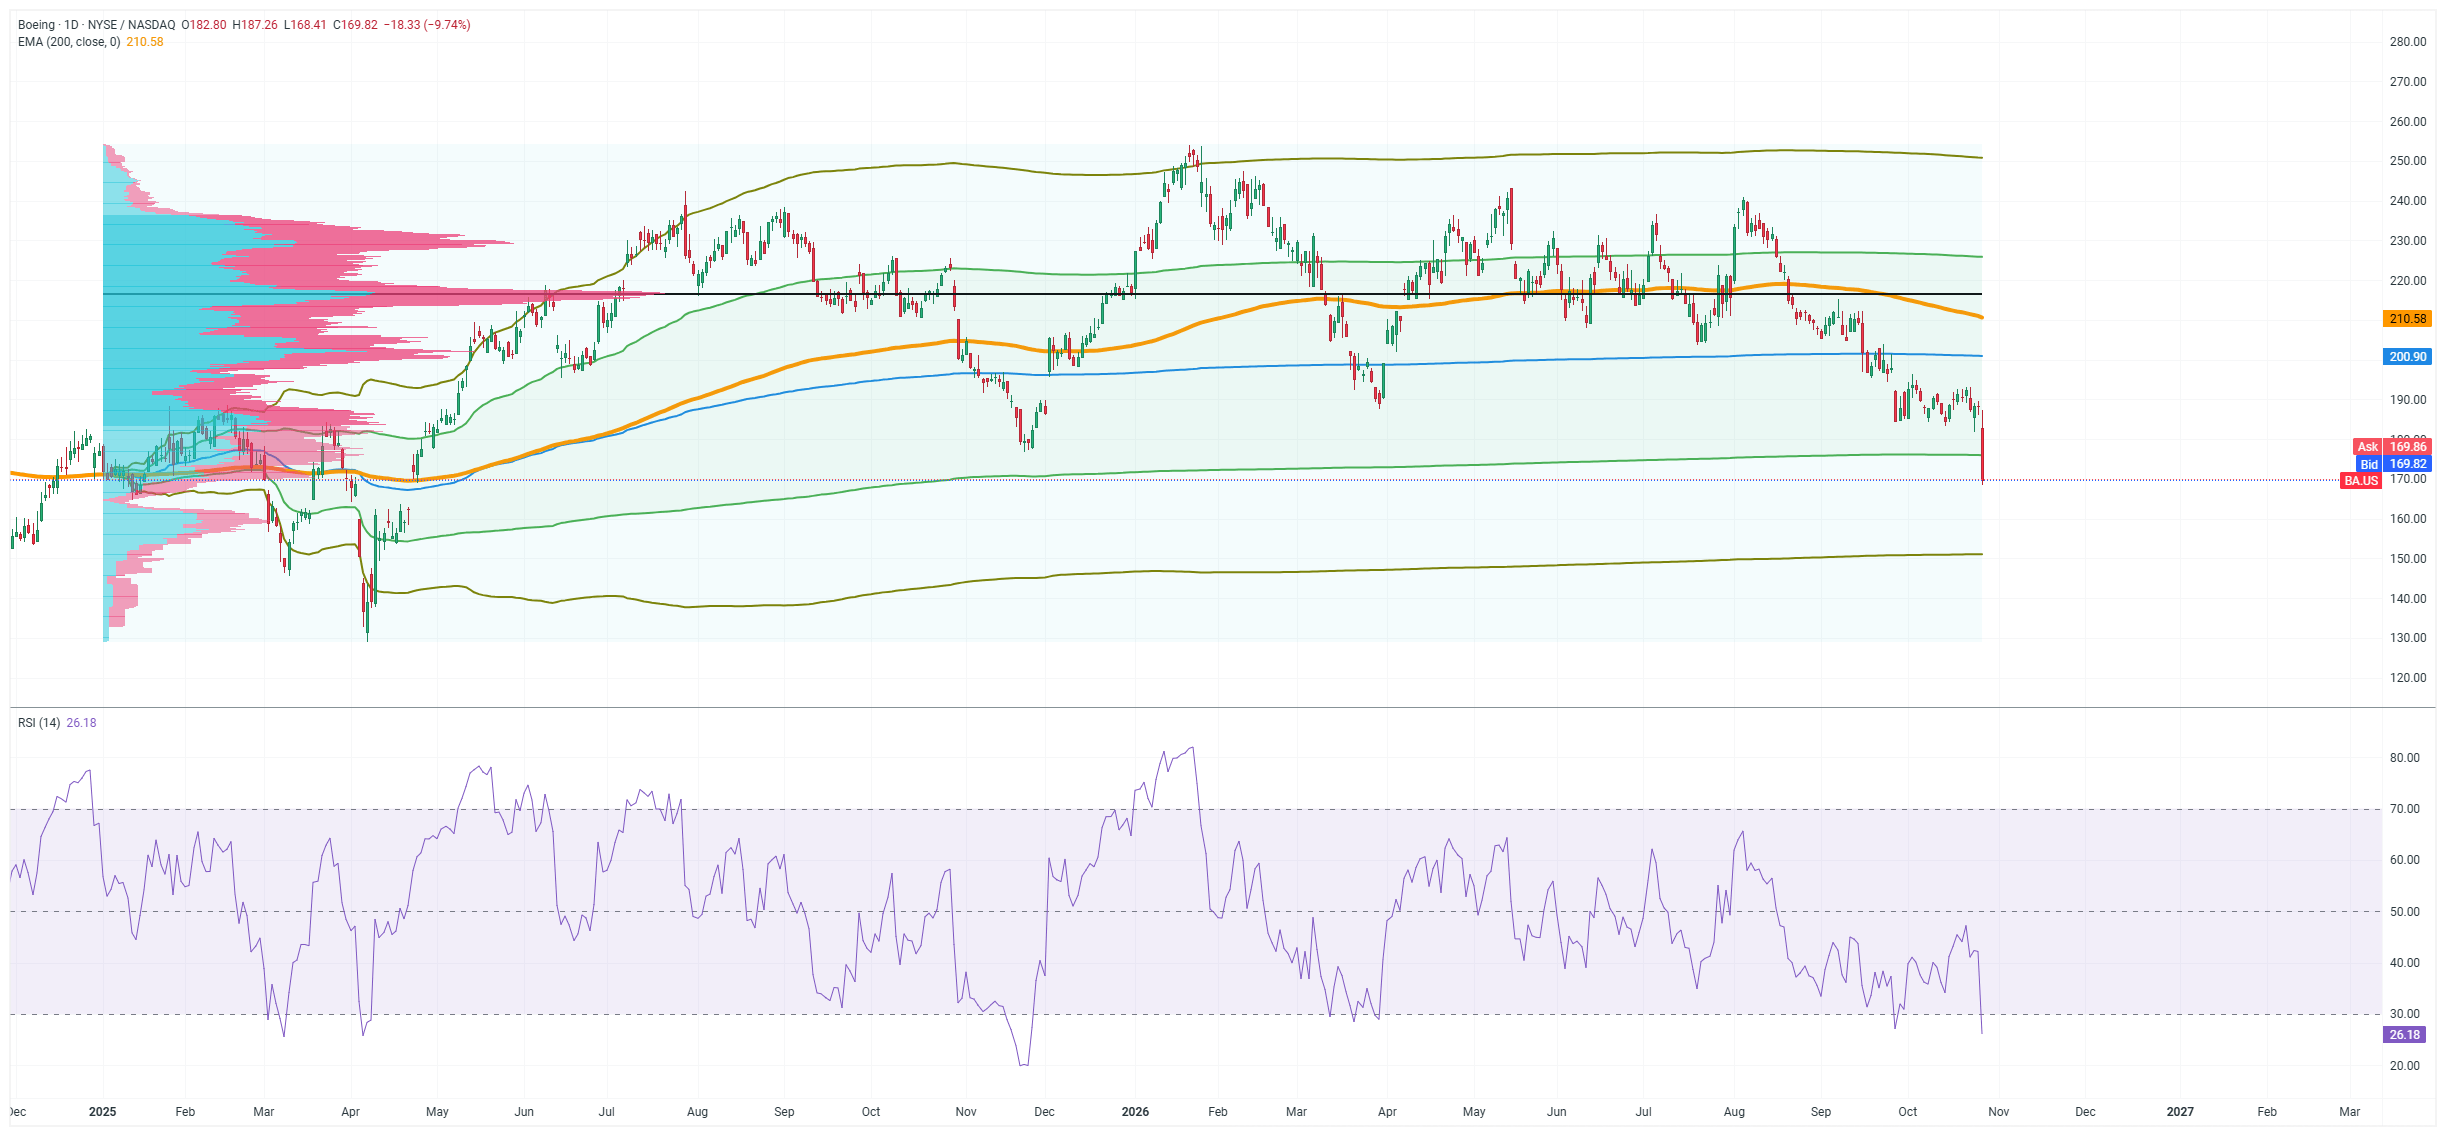
From a technical perspective, today’s slump has pushed the price below the multi-month consolidation range within which the asset traded for almost the entirety of 2025 and 2026, roughly between US$190 and US$250, centred around US$220. The price has fallen well below the 200-session exponential moving average, which stands at around 210, breaking through a whole cluster of key moving averages in a single move. The volume profile shows that the largest trading cluster extends high up, between US$210 and US$240, with a dense cluster around US$220.
This means that a significant proportion of investors built up positions above the current price and are now sitting on a loss, turning this entire area into a supply barrier that will weigh on the market during any attempt at a rebound. Below today’s levels, volume is thinner, and only the $150 to $160 range can provide any real support. The RSI has fallen to around 26, deep into oversold territory, which confirms the panic-driven nature of the sell-off, although a break below a key support level against a backdrop of weak fundamental news is not, in itself, yet a signal of a reversal.