S&P 500 — US Large Cap Index
 FTSE 100 — UK Blue Chips
 Euro Stoxx 50 — Eurozone Leaders
 DAX 40 — German Equities
 CAC 40 — French Market Index
 Nikkei 225 — Japan Benchmark
 Hang Seng — Hong Kong Index
 Shanghai Composite — China Mainland
 ASX 200 — Australian Market
 TSX Composite — Canada Index
 Nifty 50 — India Large Cap
 STI Index — Singapore Market
 KOSPI — South Korea Index
 Bovespa — Brazil Equities
 JSE Top 40 — South Africa Index
 IPC Index — Mexico Market
Chart of The Day – GBP/USD down on slower UK GDP growth! Unbreakable sideways trend?


The pound snaps its winning streak following the release of the latest UK GDP data. Economic growth slowed noticeably, although June figures point to a fairly resilient consumer. UK bond yields remain largely unchanged, but GBP/USD—trapped in consolidation—found a reason to resume its decline after bouncing off immediate resistance.
Technical Analysis: GBPUSD (D1)
GBP/USD is trading in a firmly entrenched sideways trend, partially reflecting monetary policy uncertainty in both economies, with the exchange rate currently sitting right where it started the year. Following yesterday’s breakout above the local peak at 1.3545, quotes are currently testing the 23.6% Fibonacci retracement level (1.3480), which coincides with the 10-day exponential moving average (EMA10; yellow). Holding the price above the cluster of moving averages (EMA10, EMA30, and EMA100 at 1.3400–1.3470) will be crucial to preserving the recent rebound and attempting to break out of the sideways trend. The RSI (14) at 58.2 leaves room for upside, though the absence of a bullish macroeconomic impulse also means there is no springboard for a sharp rally. The main resistance remains the local peak at 1.3545, while key support lies at 1.3440 (38.2% Fibo).
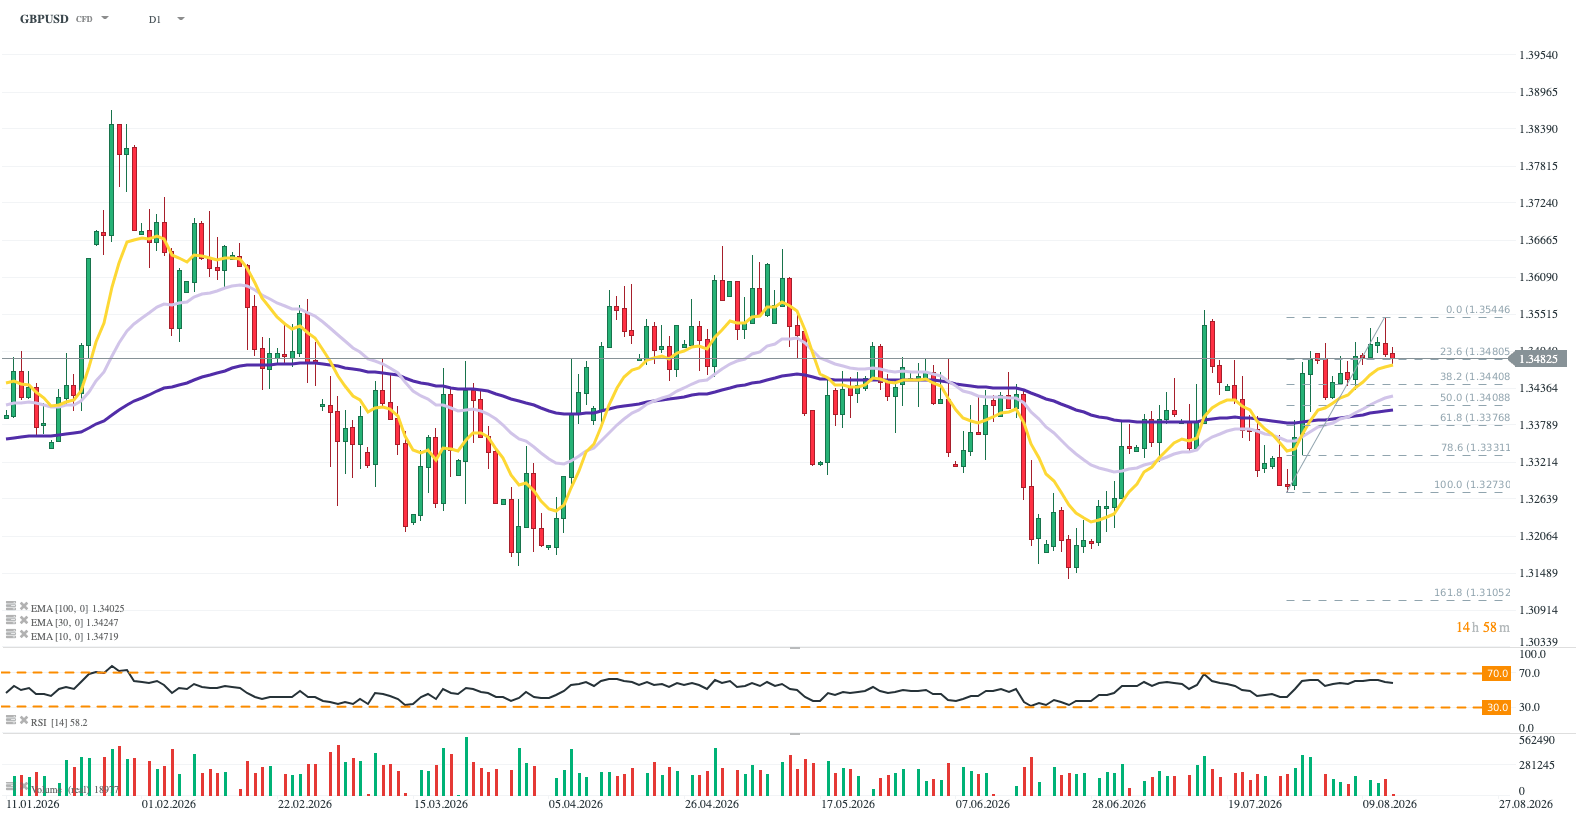
Source: xStation5
What is driving GBP/USD today?
- UK GDP growth decelerates: UK GDP growth slowed to 0.4% in Q2 from 0.6% in Q1. However, June came in better than expected, with the economy expanding 0.3% against forecasts of a 0.1% decline.
- Services-led expansion: Growth was overwhelmingly driven by a 0.5% jump in the services sector, led by a 2.7% gain in information and communication. Construction output rose 0.3%, while industrial production remained flat across the quarter.
- Consumer resilience vs. looming headwinds: UK economic resilience has been sustained primarily by consumers who maintained their spending, buoyed by sunny weather and the World Cup atmosphere—benefiting small retail, hospitality, and advertising. However, this resilience could gradually evaporate as Middle East conflict disruptions and a 13% increase in the energy price cap hit household budgets. Chancellor John Healey emphasized the need to drive growth nationwide amid these ongoing challenges.