
The Overbalance analysis aims to identify three financial instruments, analyzed primarily on the daily/four-hour (D1/H4) timeframe. The analysis uses only the Overbalance methodology, which helps determine where a trend may continue or where it may reverse. Today’s analysis covers three instruments, evaluated solely in terms of 1:1 correction structures EURCAD Since March 10, EURCAD has been trading in an uptrend; however, during yesterday’s session, the local 1:1 bullish pattern was negated at the 1.6040 level. According to the Overbalance methodology, this may support a scenario involving a return to the downtrend. Further confirmation would be a return of the price below the 1.5948 level, i.e., back into the previous downtrend. On the other hand, a break above 1.6040 could restore the bullish scenario.
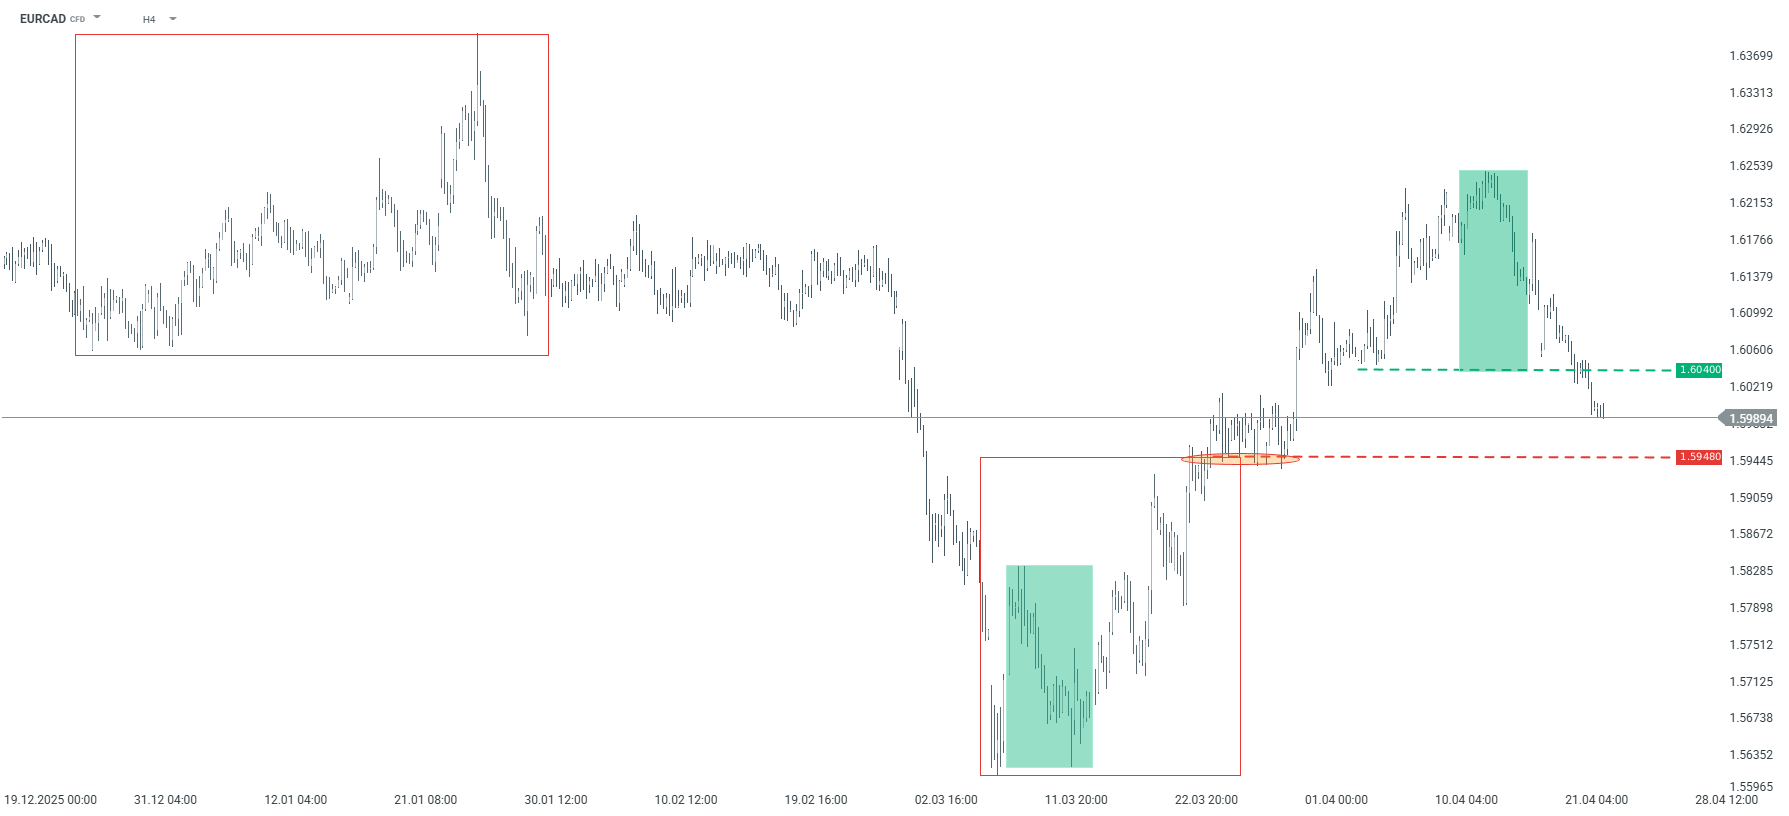
EURCAD – H4 timeframe. Source: xStation EURUSD Since mid-March, the EURUSD has been trending upward, but in recent days we have seen a downward correction. The price is approaching key support at the 1.1650 level, which stems from the lower boundary of the local 1:1 pattern. A potential bounce at this point could lead to the generation of another upward impulse. Conversely, a sustained break below the 1.1650 level would open the way for a return to the downtrend.
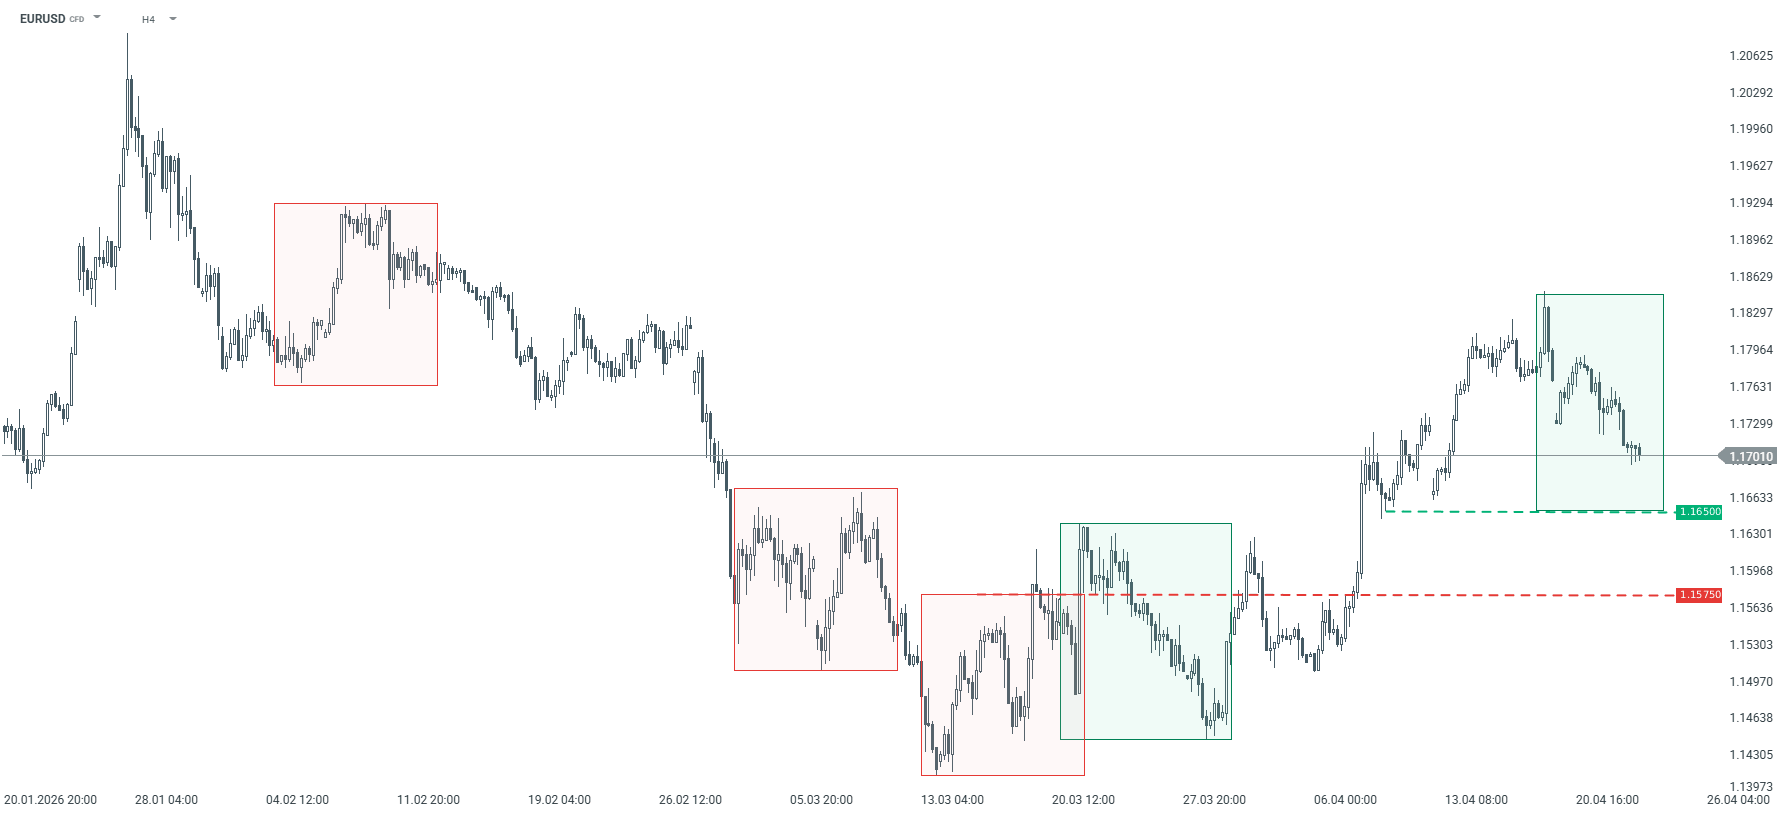
EURUSD – H4 chart. Source: xStation GBPUSD The GBPUSD pair is showing a situation very similar to that of the EURUSD. An uptrend has been in place since late March, but a correction has emerged in recent days. Should this correction deepen, the key support level remains at 1.3428. A break below this level could open the way for declines, which would be confirmed upon a drop below 1.3360—the polarity of the previously negated 1:1 downward geometric pattern.
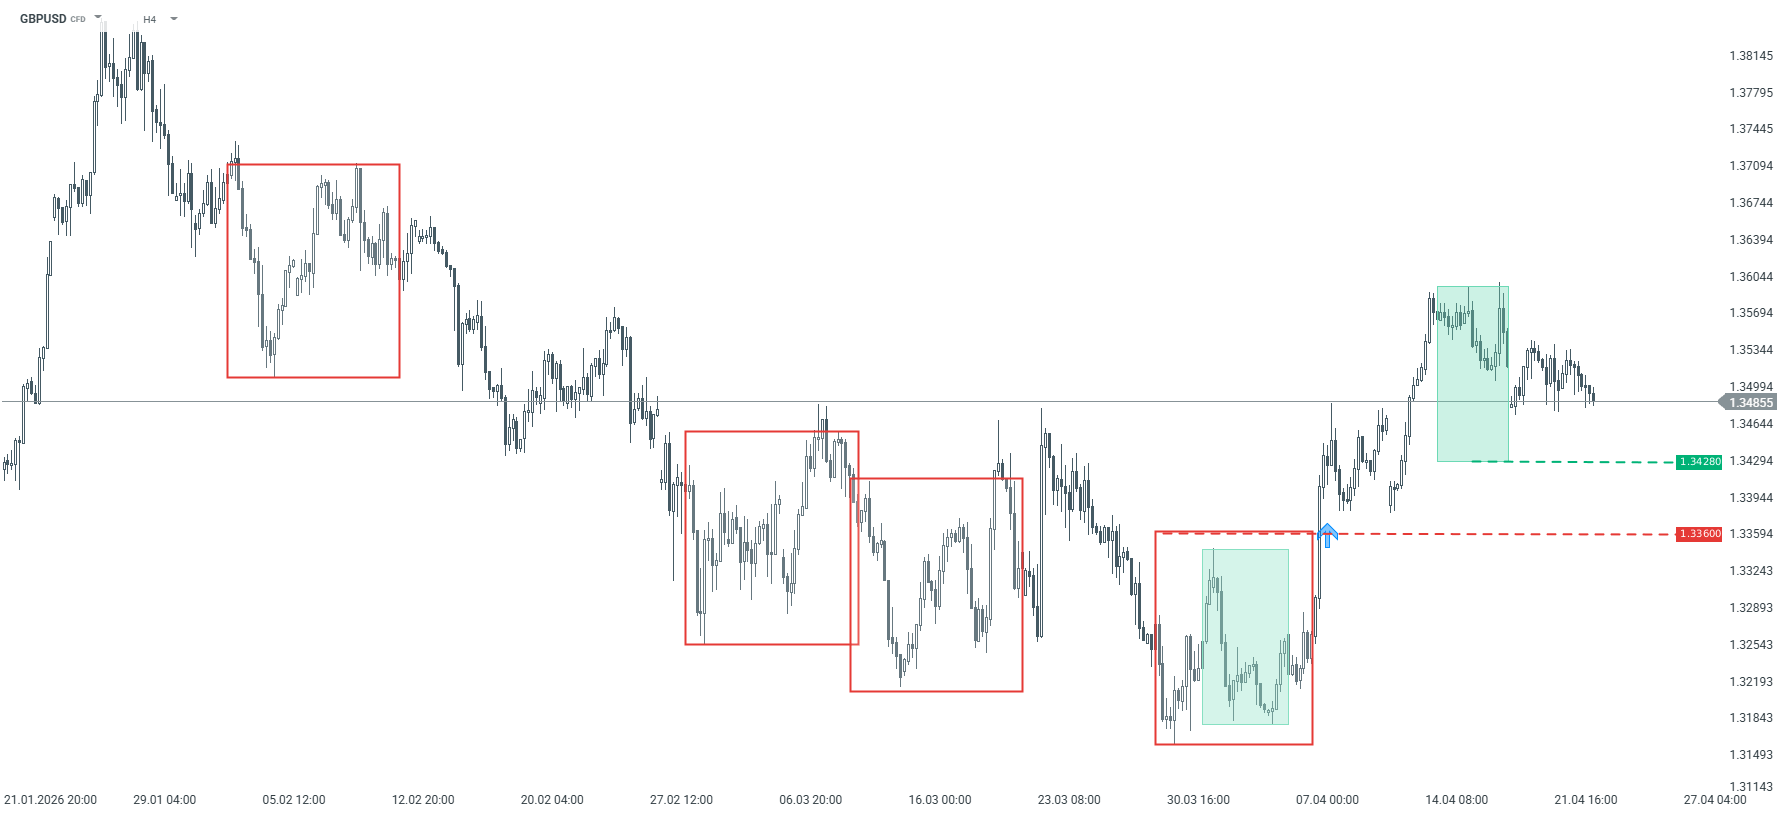
GBPUSD – H4 timeframe. Source: xStation

الربح
الجميع يسارعون إلى خفض التكاليف. أما نحن، فنسرع نحو تحقيق الأرباح.
ابدأ البيع من خلال تقديم الخدمات