S&P 500 — US Large Cap Index
 FTSE 100 — UK Blue Chips
 Euro Stoxx 50 — Eurozone Leaders
 DAX 40 — German Equities
 CAC 40 — French Market Index
 Nikkei 225 — Japan Benchmark
 Hang Seng — Hong Kong Index
 Shanghai Composite — China Mainland
 ASX 200 — Australian Market
 TSX Composite — Canada Index
 Nifty 50 — India Large Cap
 STI Index — Singapore Market
 KOSPI — South Korea Index
 Bovespa — Brazil Equities
 JSE Top 40 — South Africa Index
 IPC Index — Mexico Market

Gold breaks important support levels a day ahead of the Fed decision, during which the market is largely confident of an interest rate hike
Gold is down about 0.75% today, pulling back toward $4,266 per ounce on the eve of the Federal Reserve decision. Short-term investors fear position reductions in gold due to sharply rising yields. On the other hand, in the long term, gold is more indifferent to interest rates, but correlates more with long-term inflation and may respond to rising fiscal risks in the US.
In the context of the upcoming Wednesday, key will be not only the Fed decision itself, but the projections (dot plot) and the tone of the press conference. It may turn out that Kevin Warsh decides to hike rates, but sends a message indicating that this is merely an adjustment move. On the other hand, there is a possibility of emphasizing his desire to fight inflation, but at the same time a scenario without a rate hike cannot be ruled out.
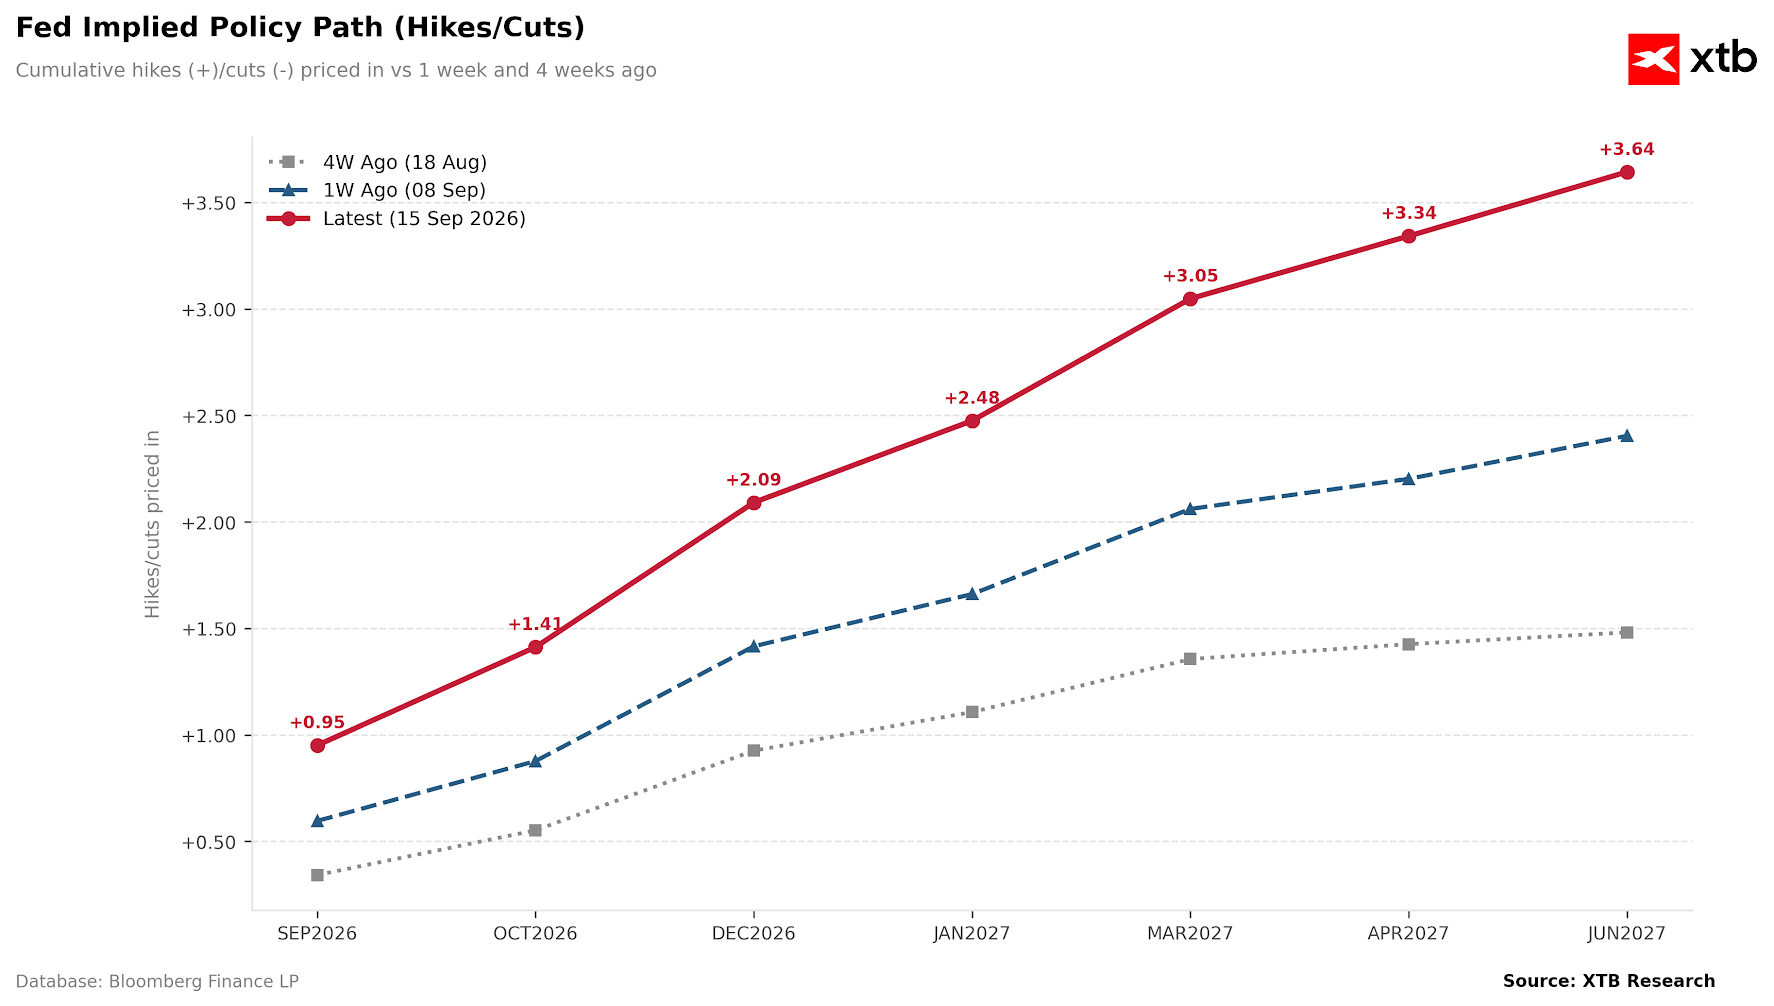
The market is certain of a rate hike on Wednesday, and is pricing in over 3 hikes by June 2027. Source: Bloomberg Finance LP, XTB The backdrop is complicated by rising oil prices. Higher commodity prices boost inflation expectations, which traditionally supports gold as a hedge, but simultaneously increases the prospect of Fed rate hikes, which is killer for gold in the short term. Today, the market is pricing in the second interpretation: more expensive oil works against the metal, not in its favor. However, it is worth paying attention to the aspect regarding further reserve diversification by central banks. China has clearly increased its gold purchases in recent months, buying 20 tons of gold for the second consecutive month, representing up to 10% of quarterly demand from all central banks.
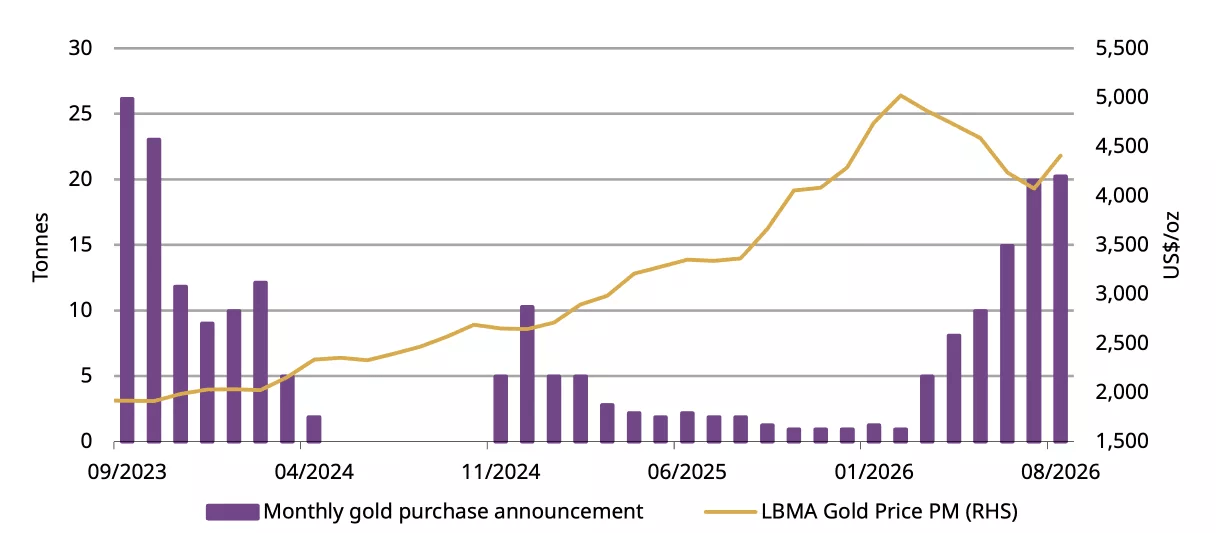
PBOC significantly increases gold purchases. Source: WGC
Technical analysis
Gold prices recently broke two important structures at once: an ascending trendline drawn along the lows from late July and early August, and a horizontal support zone in the $4,310–4,330 range, which coincides with the SMA100 (4,327) and constitutes a potential neckline of a Head and Shoulders pattern. This is the first clear signal of weakening bullish momentum since the start of the August rally. The price is currently testing the 61.8% Fibonacci retracement of the entire upward wave ($4,266) and the SMA50 (4,274), which was breached to the downside. Remaining below this zone at the session close would open the door toward $4,158 (78.6%), and in an extreme scenario to the psychological barrier of $4,000, where a full retracement of the move lies. For the bulls, the minimum task is a return above 4,330. Only reclaiming 4,437 (SMA25) and the 4,500 zone would invalidate the current bear market signal and restore the scenario for an attack on the highs near 4,692. It is worth noting that the price remains clearly below the SMA200 (4,548), which keeps the initiative on the supply side in the medium term. The chart structure indicates that the Fed decision will be the decisive catalyst. Current levels are a sensitive point from which the market will make a move in one direction or the other. It is also worth noting the strong correlation with the EURUSD pair. If the wind stops blowing into the dollar’s sails, it could also be an important signal for gold.
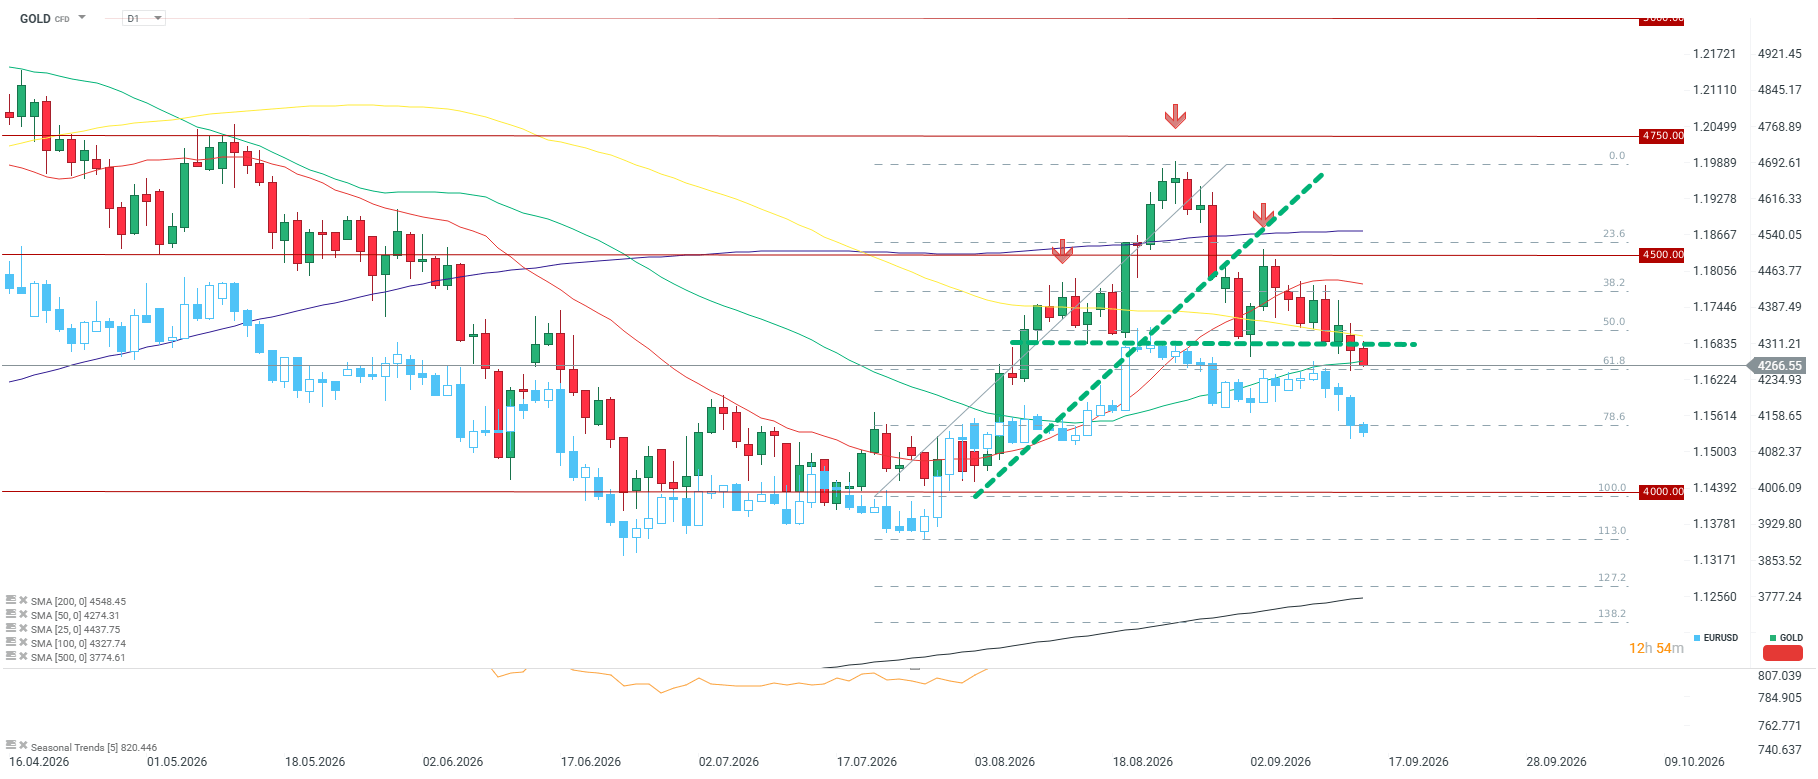
Source: xStation5
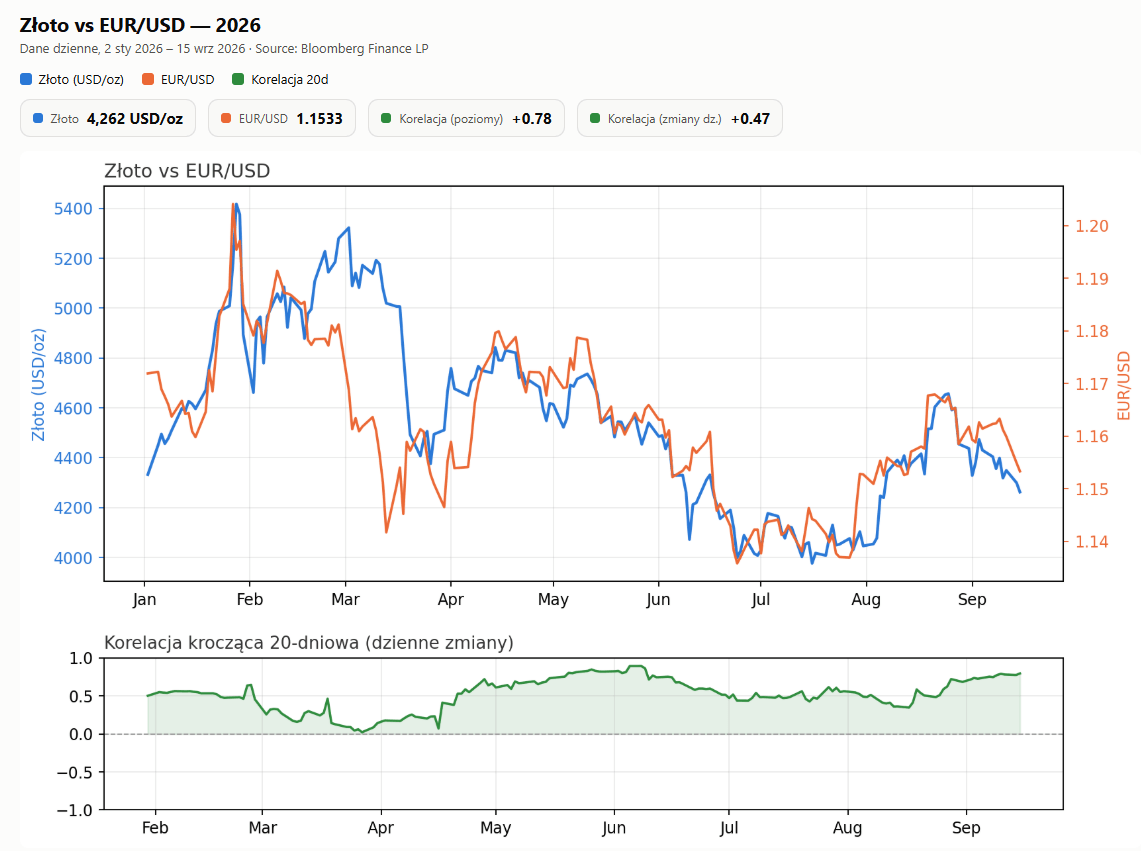
High correlation between gold and EURUSD. Source: Bloomberg Finance LP, XTB