S&P 500 — US Large Cap Index
 FTSE 100 — UK Blue Chips
 Euro Stoxx 50 — Eurozone Leaders
 DAX 40 — German Equities
 CAC 40 — French Market Index
 Nikkei 225 — Japan Benchmark
 Hang Seng — Hong Kong Index
 Shanghai Composite — China Mainland
 ASX 200 — Australian Market
 TSX Composite — Canada Index
 Nifty 50 — India Large Cap
 STI Index — Singapore Market
 KOSPI — South Korea Index
 Bovespa — Brazil Equities
 JSE Top 40 — South Africa Index
 IPC Index — Mexico Market
The US100 is just 3% off its highs, and valuations… are surprisingly low!


Looking at the price chart, the US Nasdaq technology index is within touching distance of its all-time highs. With the chart at such high levels, it’s easy to conclude that the market is extremely overheated and inflated. But is that really the case?
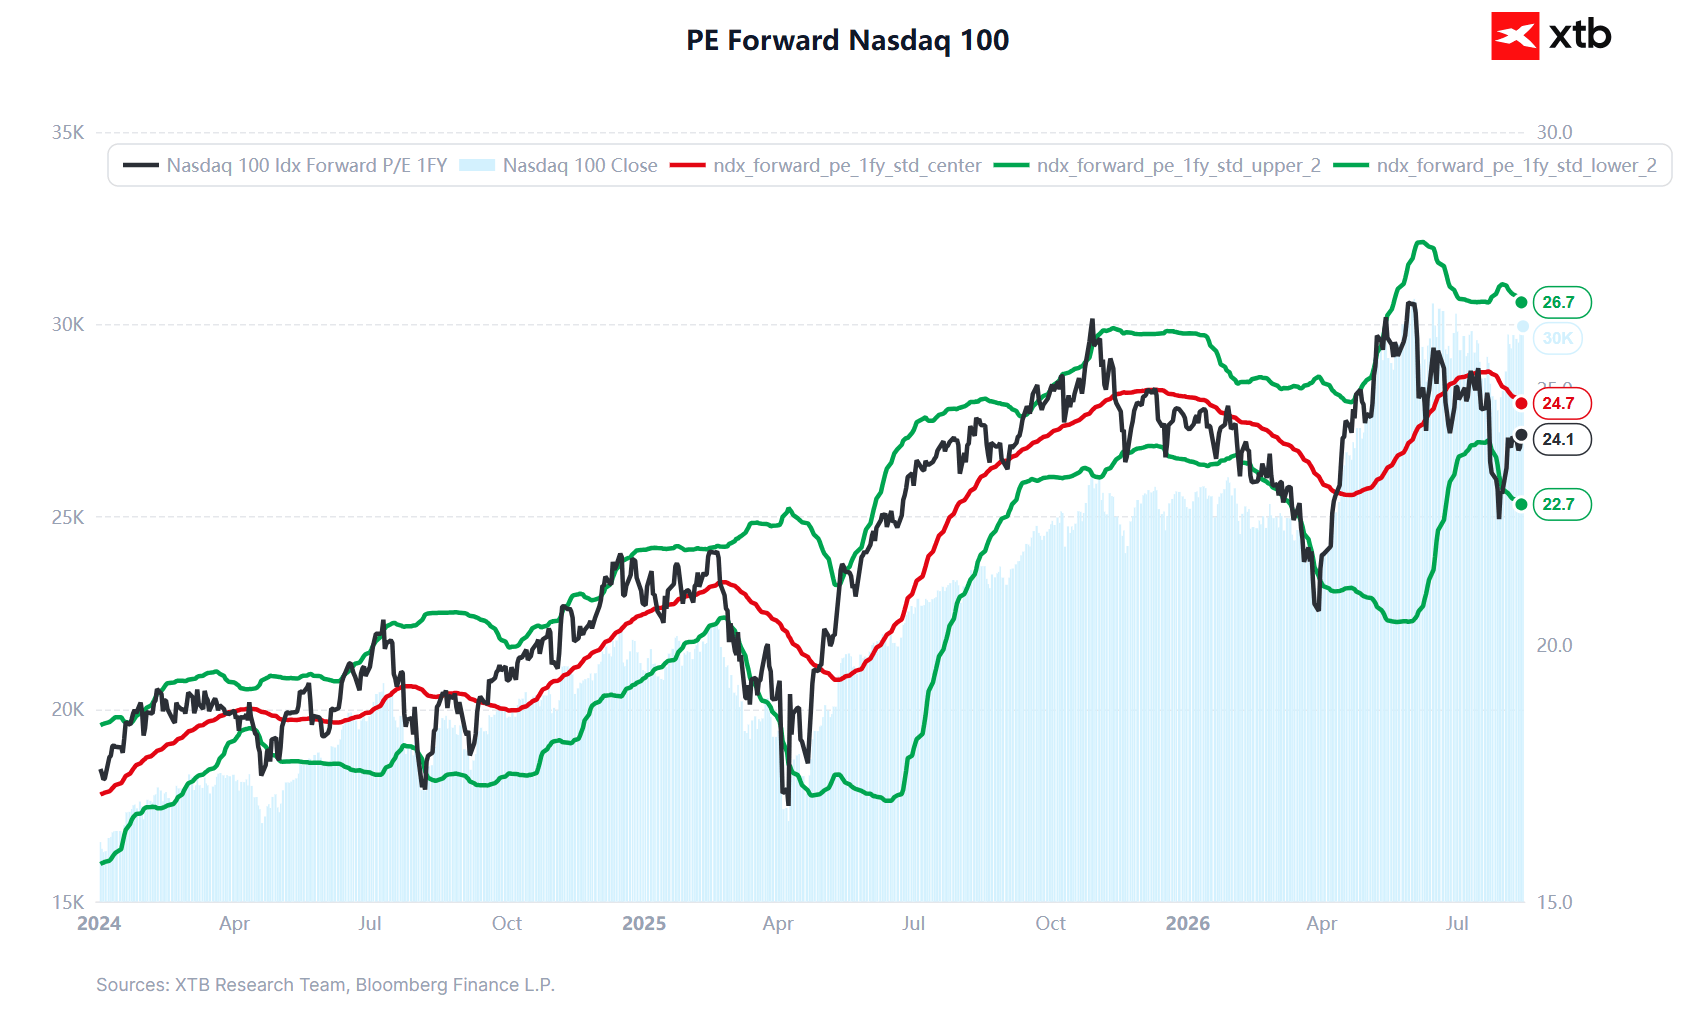
If we look beneath the surface at the underlying fundamentals, the picture is quite different. Let’s take a look at the chart for the Forward P/E ratio (price to forecast earnings for the next 12 months): Currently, this ratio stands at just 24.1 . Most importantly – the market is trading below its average (the red line at 24.7) which has been in place since 2023! Source: XTB
What does this mean in practice?
Although the index is trading close to its highs, in terms of the price-to-earnings ratio, the market is not even within the range of its average values from the current bull market, let alone its upper limits (26.7). One thing is clear: the largest technology companies are literally ‘growing into’ their valuations through a sharp rise in their generated (forecast) profits. Paradoxically, in fundamental terms, we are currently buying into this market at a lower price than at many points over the past year, when the index itself was significantly lower. We are therefore seeing a combination of an excellent second quarter – which turned out to be one of the best in Wall Street’s history in terms of earnings growth – and further euphoric forecasts for the future. If US companies do indeed meet investors’ expectations in the coming quarters, the current bull market on the stock exchange could be set to continue.