S&P 500 — US Large Cap Index
 FTSE 100 — UK Blue Chips
 Euro Stoxx 50 — Eurozone Leaders
 DAX 40 — German Equities
 CAC 40 — French Market Index
 Nikkei 225 — Japan Benchmark
 Hang Seng — Hong Kong Index
 Shanghai Composite — China Mainland
 ASX 200 — Australian Market
 TSX Composite — Canada Index
 Nifty 50 — India Large Cap
 STI Index — Singapore Market
 KOSPI — South Korea Index
 Bovespa — Brazil Equities
 JSE Top 40 — South Africa Index
 IPC Index — Mexico Market
Facts:
- Oil has already fallen more than 22% YTD and 30% from the 2025 peak.
- The International Energy Agency (IEA) warns that global oversupply could reach as much as 4 million barrels per day next year, which would mark the largest and longest-lasting surplus in at least a decade.
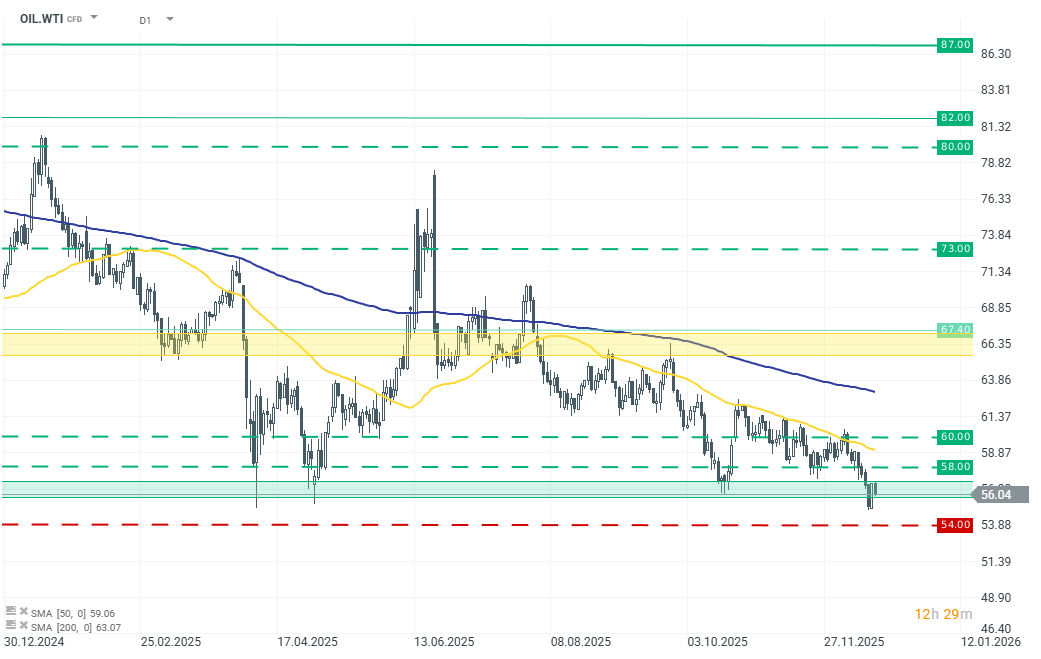
- WTI crude (OIL.WTI) is trading near a key technical support zone around 55–56 USD per barrel.
Recommendation:
Long position at market price
- TP1: 58 USD
- TP2: 60 USD
- SL: 54 USD
Opinion:
WTI crude dropped at the beginning of the week to the lowest levels since 2021, and the magnitude of the decline — more than 22% YTD and roughly 30% below this year’s highs — points to a deeply oversold market. Current price levels coincide with a major technical support area at 55–56 USD, which has historically acted as a turning point on the chart. At the same time, the market reacted with a sharp intraday rebound (+2% on 17 December) following geopolitical headlines regarding Venezuela and the prospect of renewed US sanctions on Russia. While these developments do not change the underlying fundamentals, they can provide short-term upside impulses within an oversold downtrend.
Despite an attractive setup for a short-term bounce, the long-term outlook for oil remains negative. The IEA projects that 2026 could see an oversupply of up to 4 million barrels per day, which would be the largest and most prolonged surplus in at least 10 years. The US EIA also expects significant oversupply, though somewhat smaller (around 2 million bpd). In that context, sanctions on Venezuela or Russia have limited impact on the overall global balance.
Taking all the above factors into account, we recommend opening a long position at current levels. However, from a long-term perspective, we still expect the broader downtrend to persist. We additionally recommend setting a stop-loss order to minimize potential downside risk.