الأسواق العالمية
مؤشر S&P 500 — مؤشر الشركات الأمريكية ذات رؤوس الأموال الكبيرة
ناسداك 100 — مؤشر شركات التكنولوجيا النامية
داو جونز — المؤشر الصناعي
مؤشر FTSE 100 — الشركات الرائدة في المملكة المتحدة
مؤشر يورو ستوكس 50 — الشركات الرائدة في منطقة اليورو
مؤشر داكس 40 — الأسهم الألمانية
CAC 40 — مؤشر السوق الفرنسي
مؤشر نيكي 225 — المؤشر القياسي الياباني
هانغ سنغ — مؤشر هونغ كونغ
مؤشر شنغهاي المركب — الصين القارية
مؤشر ASX 200 — السوق الأسترالية
مؤشر TSX المركب — مؤشر كندا
مؤشر «نيفتي 50» — الشركات الهندية ذات رؤوس الأموال الكبيرة
مؤشر STI — سوق سنغافورة
KOSPI — مؤشر كوريا الجنوبية
بوفيسبا — أسهم البرازيل
مؤشر JSE Top 40 — مؤشر جنوب أفريقيا
مؤشر IPC — سوق المكسيك
MXNTechnical AnalysisUSD

USD/MXN Finds resistance around 19.20 ahead of nine-day EMA

  • USD/MXN may find support around the eight-month low at 19.16.
  • The RSI remains below the 50 level, strengthening the bearish bias.
  • The pair may target the primary barrier at the nine-day EMA of 19.27.

USD/MXN inches higher after registering losses in the previous session, trading around 19.20 during the Asian hours on Thursday. A bearish bias is prevailing as the daily chart’s technical analysis indicates the pair consolidating within a descending channel pattern.

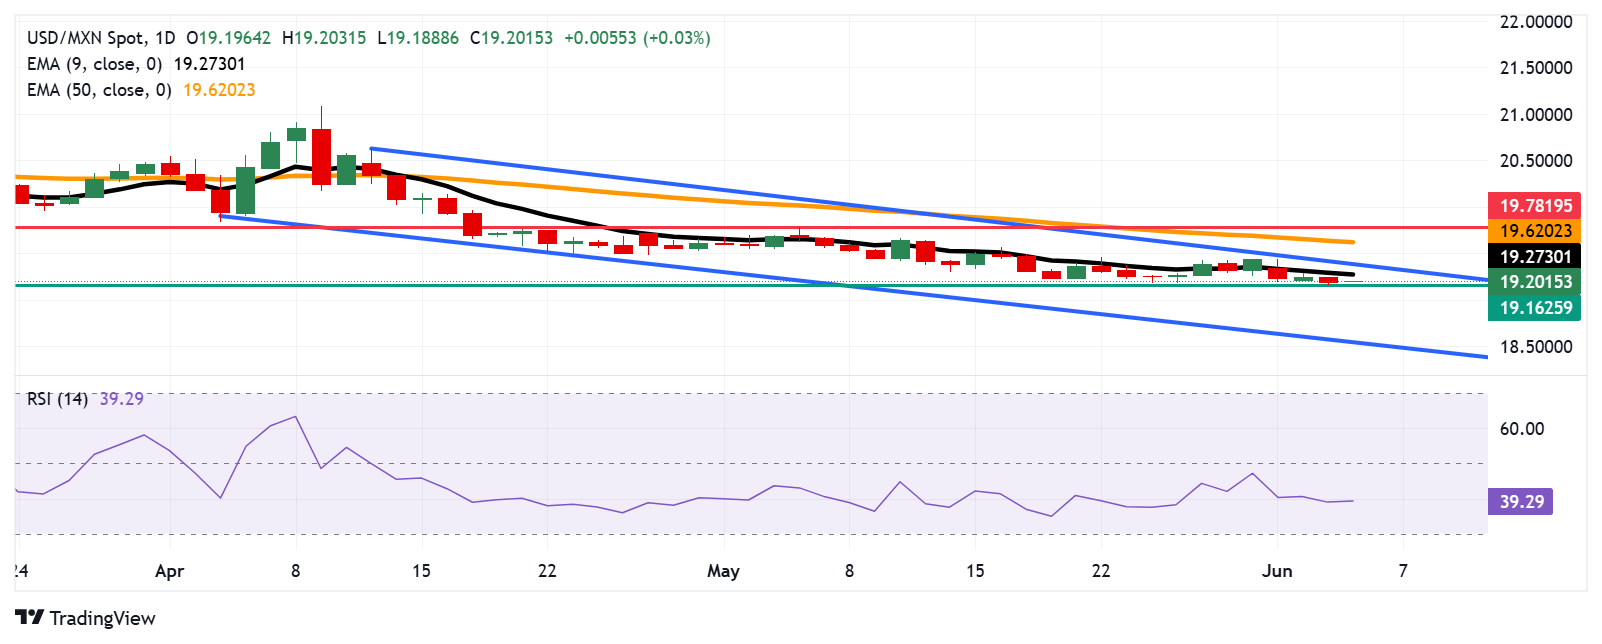
The USD/MXN remains below the nine-day Exponential Moving Average (EMA), indicating weaker short-term momentum. Additionally, the 14-day Relative Strength Index (RSI) is positioned below the 50 level, indicating a strengthening bearish bias.

On the downside, the USD/MXN could target the eight-month low of 19.16, which was recorded on June 4. A break below this level could prompt the pair to navigate the region around the lower boundary of the descending channel pattern at 18.55.

The nine-day EMA at 19.27 appears as the initial barrier, followed by the descending channel’s upper boundary around 19.40. A break above this crucial resistance zone would cause the emergence of the bullish bias and support the USD/MXN pair to test the 50-day EMA at 19.62.

A break above the 50-day EMA would improve the medium-term price momentum and prompt the USD/MXN pair to target the seven-week high at 19.78, which was marked on May 6.

USD/MXN: Daily Chart

Octalas AI
شعار Octalas

الربح

الجميع يسارعون إلى خفض التكاليف. أما نحن، فنسرع نحو تحقيق الأرباح.

ابدأ البيع من خلال تقديم الخدمات

مجانًا لمدة 14 يومًا · لا حاجة لبطاقة ائتمان
الربح من خلال الذكاء الاصطناعي

مقالات ذات صلة

اترك تعليقًا

لن يتم نشر عنوان بريدك الإلكتروني. الحقول الإلزامية مميزة بعلامة *

زر «العودة إلى الأعلى»