S&P 500 — US Large Cap Index
 FTSE 100 — UK Blue Chips
 Euro Stoxx 50 — Eurozone Leaders
 DAX 40 — German Equities
 CAC 40 — French Market Index
 Nikkei 225 — Japan Benchmark
 Hang Seng — Hong Kong Index
 Shanghai Composite — China Mainland
 ASX 200 — Australian Market
 TSX Composite — Canada Index
 Nifty 50 — India Large Cap
 STI Index — Singapore Market
 KOSPI — South Korea Index
 Bovespa — Brazil Equities
 JSE Top 40 — South Africa Index
 IPC Index — Mexico Market
Walmart falls 6% despite strong results. What did the largest U.S. retailer reveal?

Key takeaways
- Walmart’s revenue rose 5.9% YoY to $187.9 billion, while adjusted EPS came in at $0.81 versus $0.74 expected, confirming the solid condition of one of the key U.S. retailers.
- U.S. comparable sales increased, while growth across Walmart’s business remains broad-based and is not driven solely by traditional retail.
- Walmart raised its full-year sales and EPS guidance, yet the shares are down around 6% in premarket trading. This raises an important question: how is the company currently valued?
Walmart’s results for the second quarter of fiscal 2027 confirm that the U.S. consumer remains in relatively good shape, while demand is still strong enough for the country’s largest retailer to raise its full-year guidance. Revenue and adjusted earnings per share beat expectations, e-commerce and advertising grew strongly, and comparable sales remained positive. Despite this, Walmart shares are down around 6% in premarket trading, as investors focus on a more cautious outlook for the third quarter and a very high expectations bar.
Walmart confirms the strength of the U.S. consumer
Walmart’s results for the second quarter of fiscal 2027 confirm that the U.S. consumer remains in relatively good shape, while demand is still strong enough for the country’s largest retailer to raise its full-year guidance. Revenue and adjusted earnings per share beat expectations, e-commerce and advertising grew strongly, and comparable sales in the U.S. remained positive. Despite this, Walmart shares are down around 6% in premarket trading, as investors focus on a less impressive outlook for the third quarter, a decline in reported net income, and a very high expectations bar.
- Walmart’s revenue rose 5.9% YoY to $187.9 billion , versus expectations of around $186.75–186.8 billion, while adjusted EPS came in at $0.81 versus the $0.74 consensus , beating forecasts by $0.07.
- Walmart U.S. comparable sales, excluding fuel, increased by 2.6% , global e-commerce grew by 23% , and U.S. e-commerce by 24% ; the global advertising business expanded by 38% , with Walmart U.S. advertising also up 38%.
- Walmart raised its FY2027 net sales growth guidance to 4–5% from 3.5–4.5%, while adjusted EPS guidance was lifted to $2.80–2.87 from $2.75–2.85.
- For the third quarter, the company expects sales growth of 3.0–3.75% in constant currency, adjusted operating income growth of 2–4% , and adjusted EPS of $0.62–0.64 .
The consumer remains strong
The most important takeaway from Walmart’s report remains positive for the broader picture of U.S. consumption. U.S. comparable sales increased by 2.6%, despite an approximately 80 bps negative impact from the health and wellness segment, while growth was supported by a higher number of transactions. This is important because it suggests consumers are still spending and that growth is not being driven solely by higher prices. The company also pointed to strength in categories such as groceries, beauty, personal care, pet supplies, toys, and apparel. The digital side of the business looks even stronger. Global e-commerce sales rose by 23%, while growth in the U.S. reached 24%, supported by store-fulfilled pickup and delivery, marketplace, and advertising. At the same time, the global advertising business grew by 38%, with Walmart U.S. advertising revenue also up 38%. Walmart is no longer simply a volume-driven retailer — it is increasingly monetizing the scale of its platform, customer traffic, and logistics infrastructure. The profitability picture also contains several strong points, although it is more nuanced. Gross margin increased by 96 bps , largely due to tariff-related refunds, while operating income rose by 28.8% , or 17.4% on an adjusted constant-currency basis. At the same time, reported net income fell by 8.7% YoY to $6.5 billion , while diluted EPS declined by 9.1% to $0.88 . The market therefore received a strong operating picture, but not an entirely clean one.
Higher guidance supports the fundamentals, but Q3 looks more subdued
The increase in full-year guidance reinforces the positive fundamental picture. Walmart now expects net sales growth of 4–5% , while adjusted EPS is projected at $2.80–2.87 , compared with the previous range of $2.75–2.85. The midpoint of the new range is approximately $2.835 , versus $2.80 previously. The company also expects adjusted operating income to grow by 7.0–8.5% in FY2027. The shorter-term outlook raises more questions. For the third quarter, Walmart expects adjusted EPS of $0.62–0.64 , with the midpoint at $0.63 versus $0.62 a year earlier. The company also expects a more than 100 bps negative impact on sales growth due to the timing shift of Flipkart’s Big Billion Days between the third and fourth quarters. This is not weak guidance, but at a very high valuation it does not provide a strong argument for further multiple expansion. CFO John David Rainey also noted that benefits from tariff refunds received in the second quarter will be directed toward investments in customer experience and pricing in the second half of the year. This means that part of the current margin improvement may not fully translate into a sustained increase in profitability. For investors, that is an important nuance. Walmart can continue to grow at a healthy operating pace, but not every incremental benefit will flow directly to the bottom line.
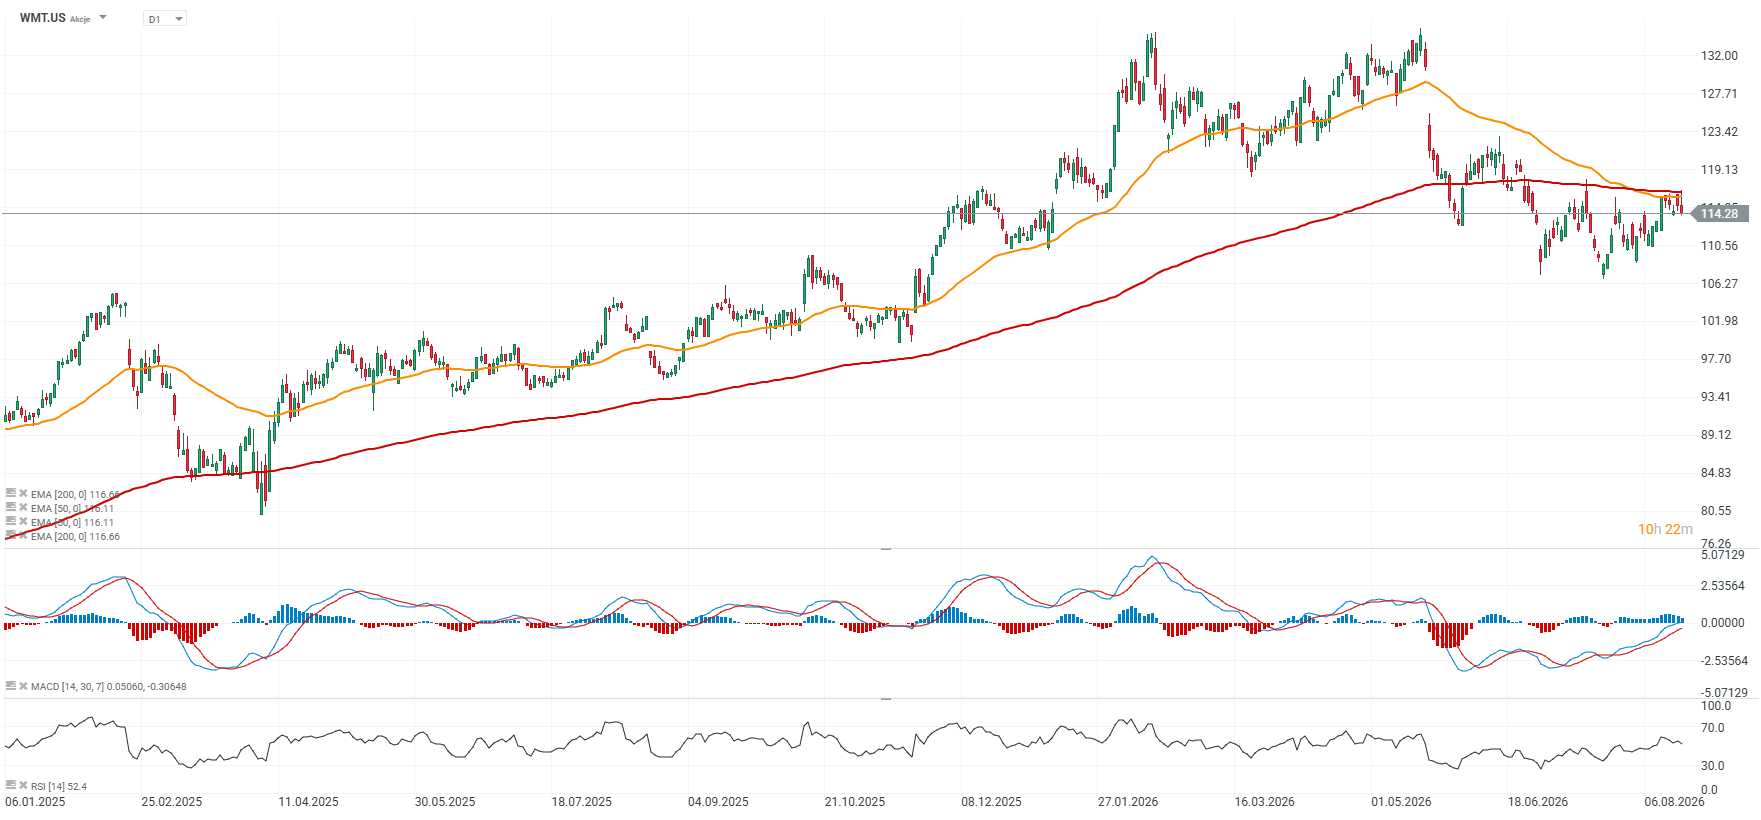
Walmart chart (D1 interval) — were expectations too high?
Shares are down around 6% despite the company beating expectations on revenue and adjusted EPS and raising its full-year guidance. The market is not questioning the strength of the consumer or the quality of Walmart’s business. In this setup, the issue is more likely valuation and the fact that, after the earlier rise in the share price, a good quarter is no longer enough to act as a catalyst. The core thesis therefore remains unchanged: Walmart confirms that the U.S. consumer is still spending and that the company’s fundamentals remain strong, but the market had been expecting an almost flawless report. Under these conditions, even higher guidance and solid growth may not be enough if near-term earnings momentum looks less impressive than before. The shares are trading below the 200-session exponential moving average (EMA200), which points to a medium-term downtrend, while the post-earnings reaction confirms the dominance of sellers. The stock is likely to open today in the $108–110 range. Key support is located near $106 based on price action, while the important resistance level is the EMA200 around $117 .
Source: xStation5
Valuation, inventories, free cash flow and return on capital
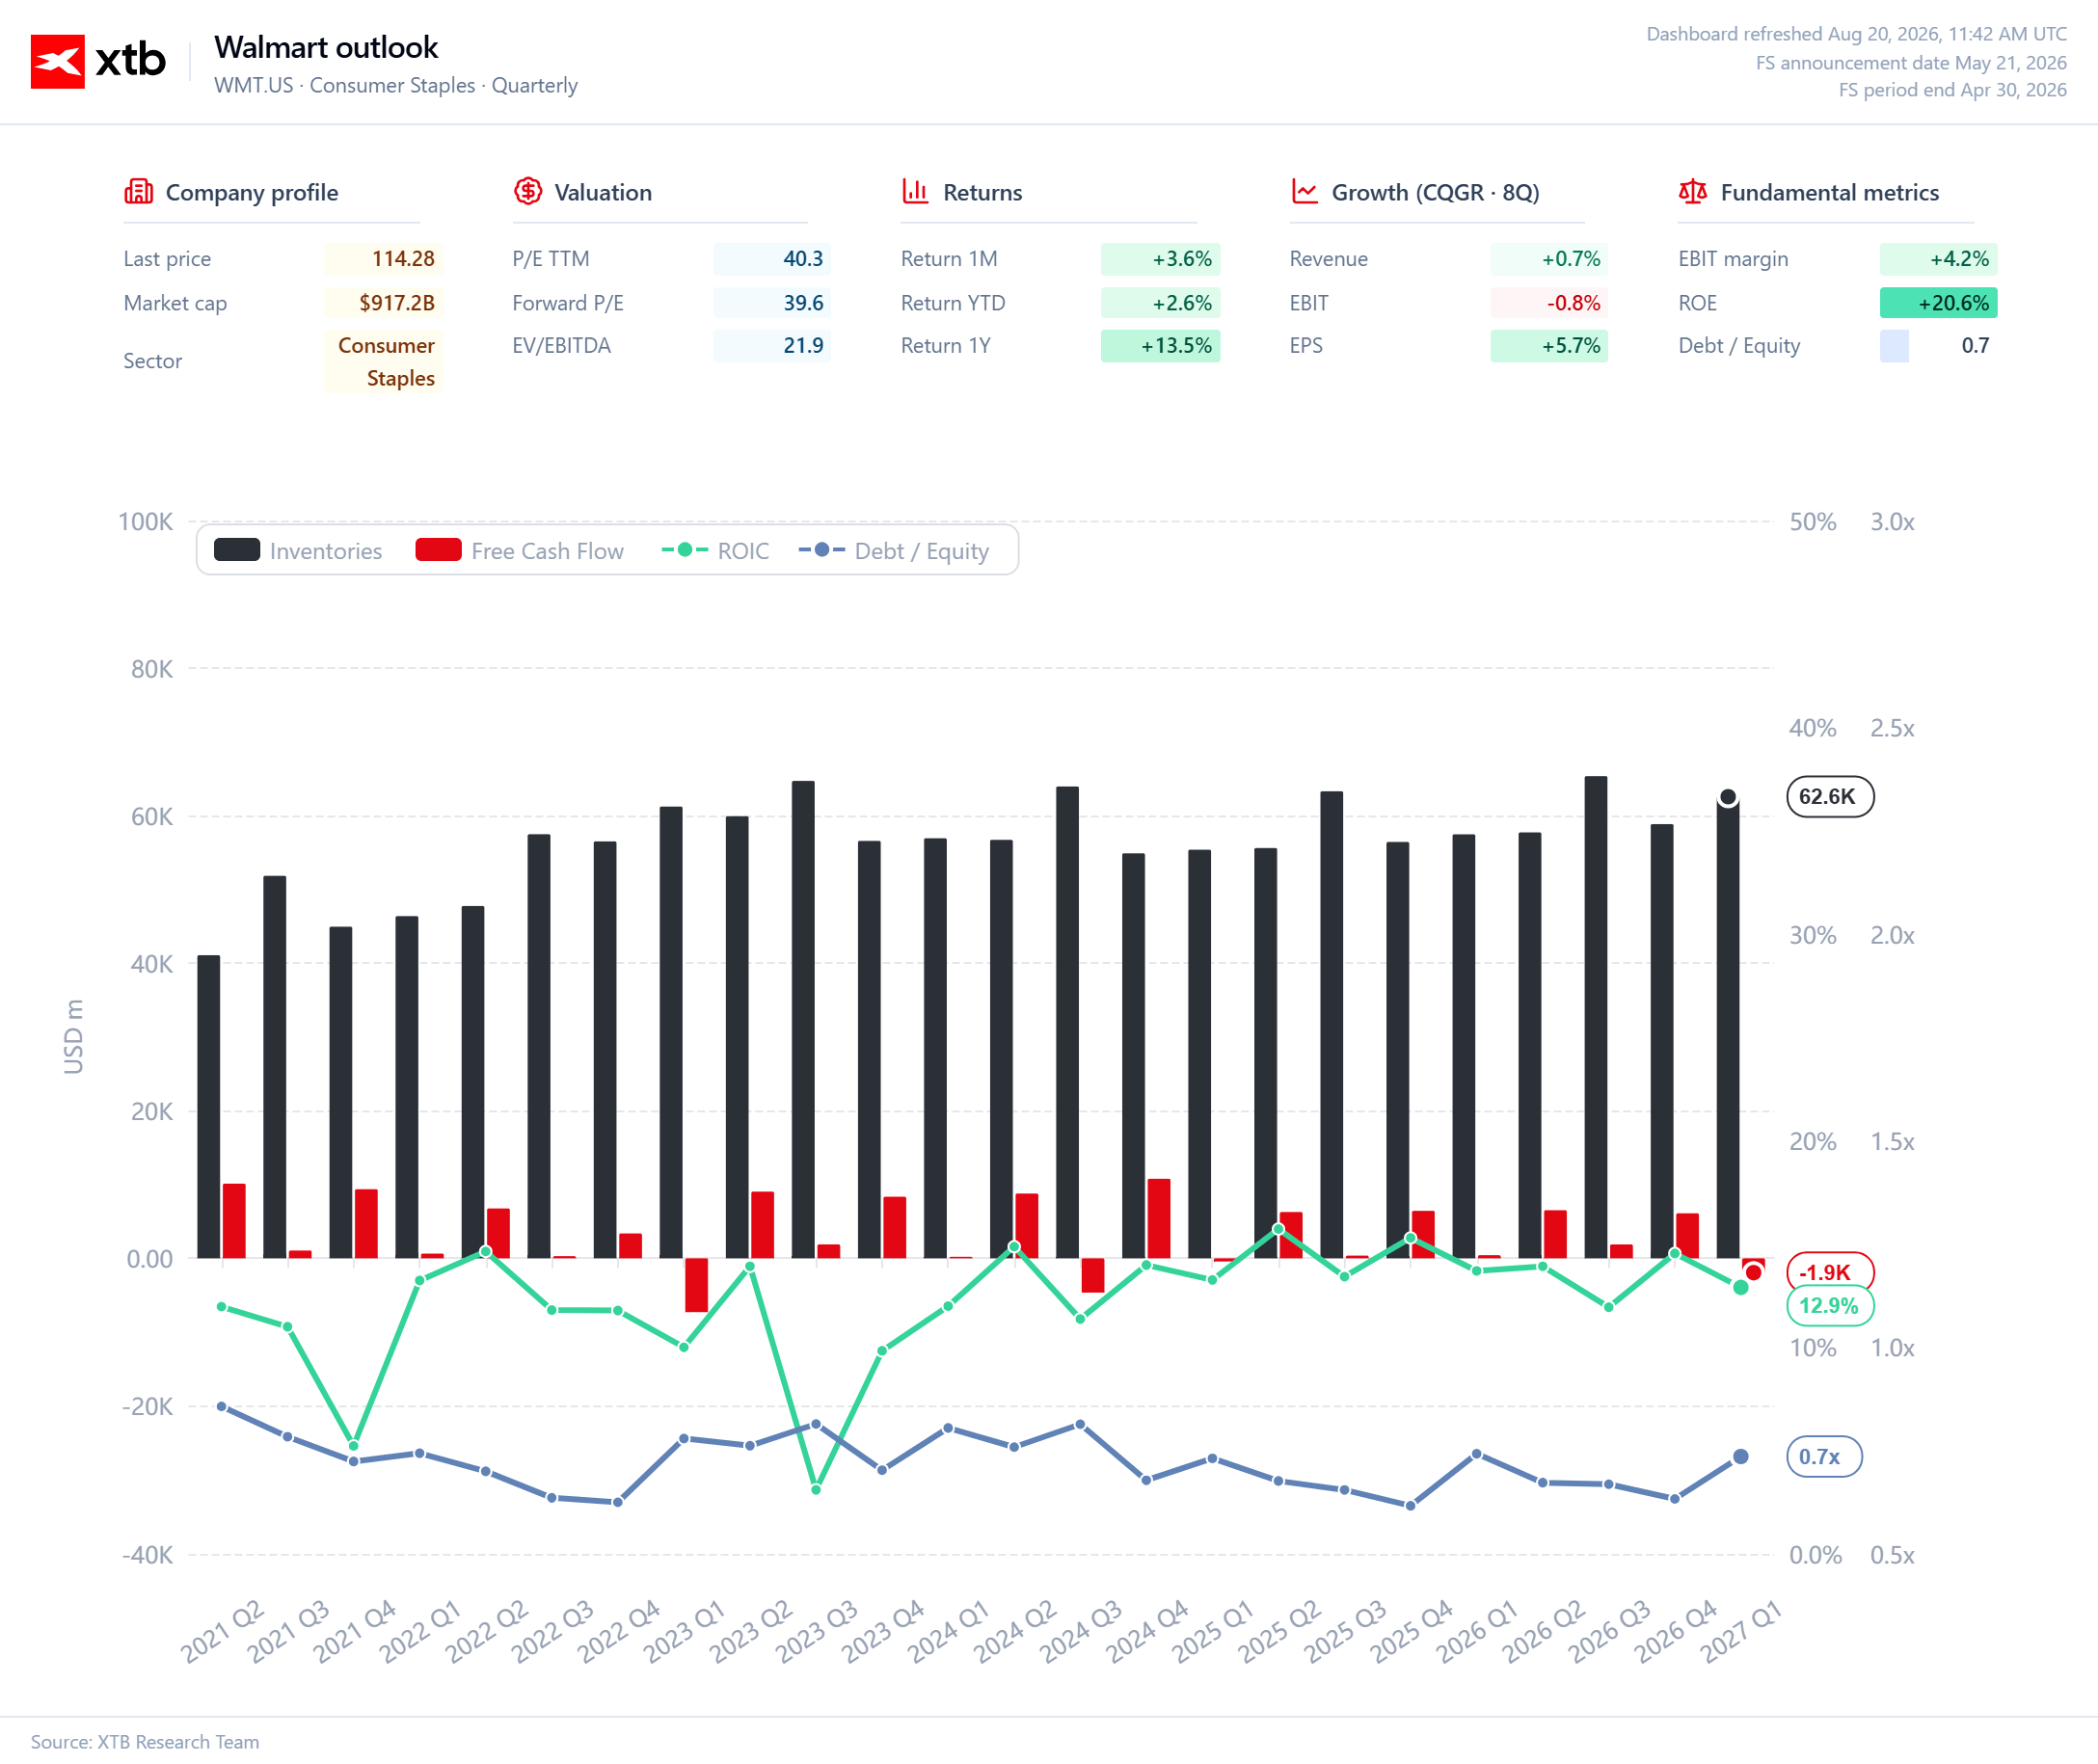
Importantly, the market is paying for quality — but it is paying a very high price. At around $114.28 per share and a market capitalization of roughly $917 billion , Walmart trades at 40.3x trailing earnings, 39.6x expected earnings over the next 12 months (forward P/E), and 21.9x EV/EBITDA , levels much closer to those of a high-quality growth company than a traditional food retailer. At this valuation, the market is effectively paying in advance for sustained margin improvement, high ROIC, and a growing contribution from higher-margin businesses, which means that even good results may prove insufficient if the pace of monetizing these advantages falls short of expectations. The first chart illustrates Walmart’s business model well: this is an operation of enormous scale, where even small movements in working capital can materially affect quarterly free cash flow. Inventories at the end of the latest period stood at around $62.6 billion and have remained structurally above pre-2022 levels for several years, which is a natural consequence of both sales growth and the larger scale of the omnichannel business. At the same time, quarterly FCF fell to around -$1.9 billion , but a single negative quarter should not be interpreted as a deterioration in business quality, because retail cash flows are highly seasonal and heavily influenced by changes in inventories and supplier payables. Far more important is ROIC at 12.9% , which remains solid for a capital-intensive retail business with an enormous base of stores, distribution centers, and logistics infrastructure. Walmart does not generate spectacular margins, but it turns capital very quickly, and that asset turnover is one of the main sources of its economic advantage. Net debt also does not look aggressive: Debt/Equity stands at around 0.7x , meaning the company does not need to rely on high financial leverage to generate attractive returns for shareholders. My view is that Walmart’s greatest strength is not high FCF in every individual quarter, but an exceptionally efficient operating machine that can consistently generate a double-digit return on invested capital despite low margins.
Source: XTB Research
Revenue is growing — the real battle is over margins
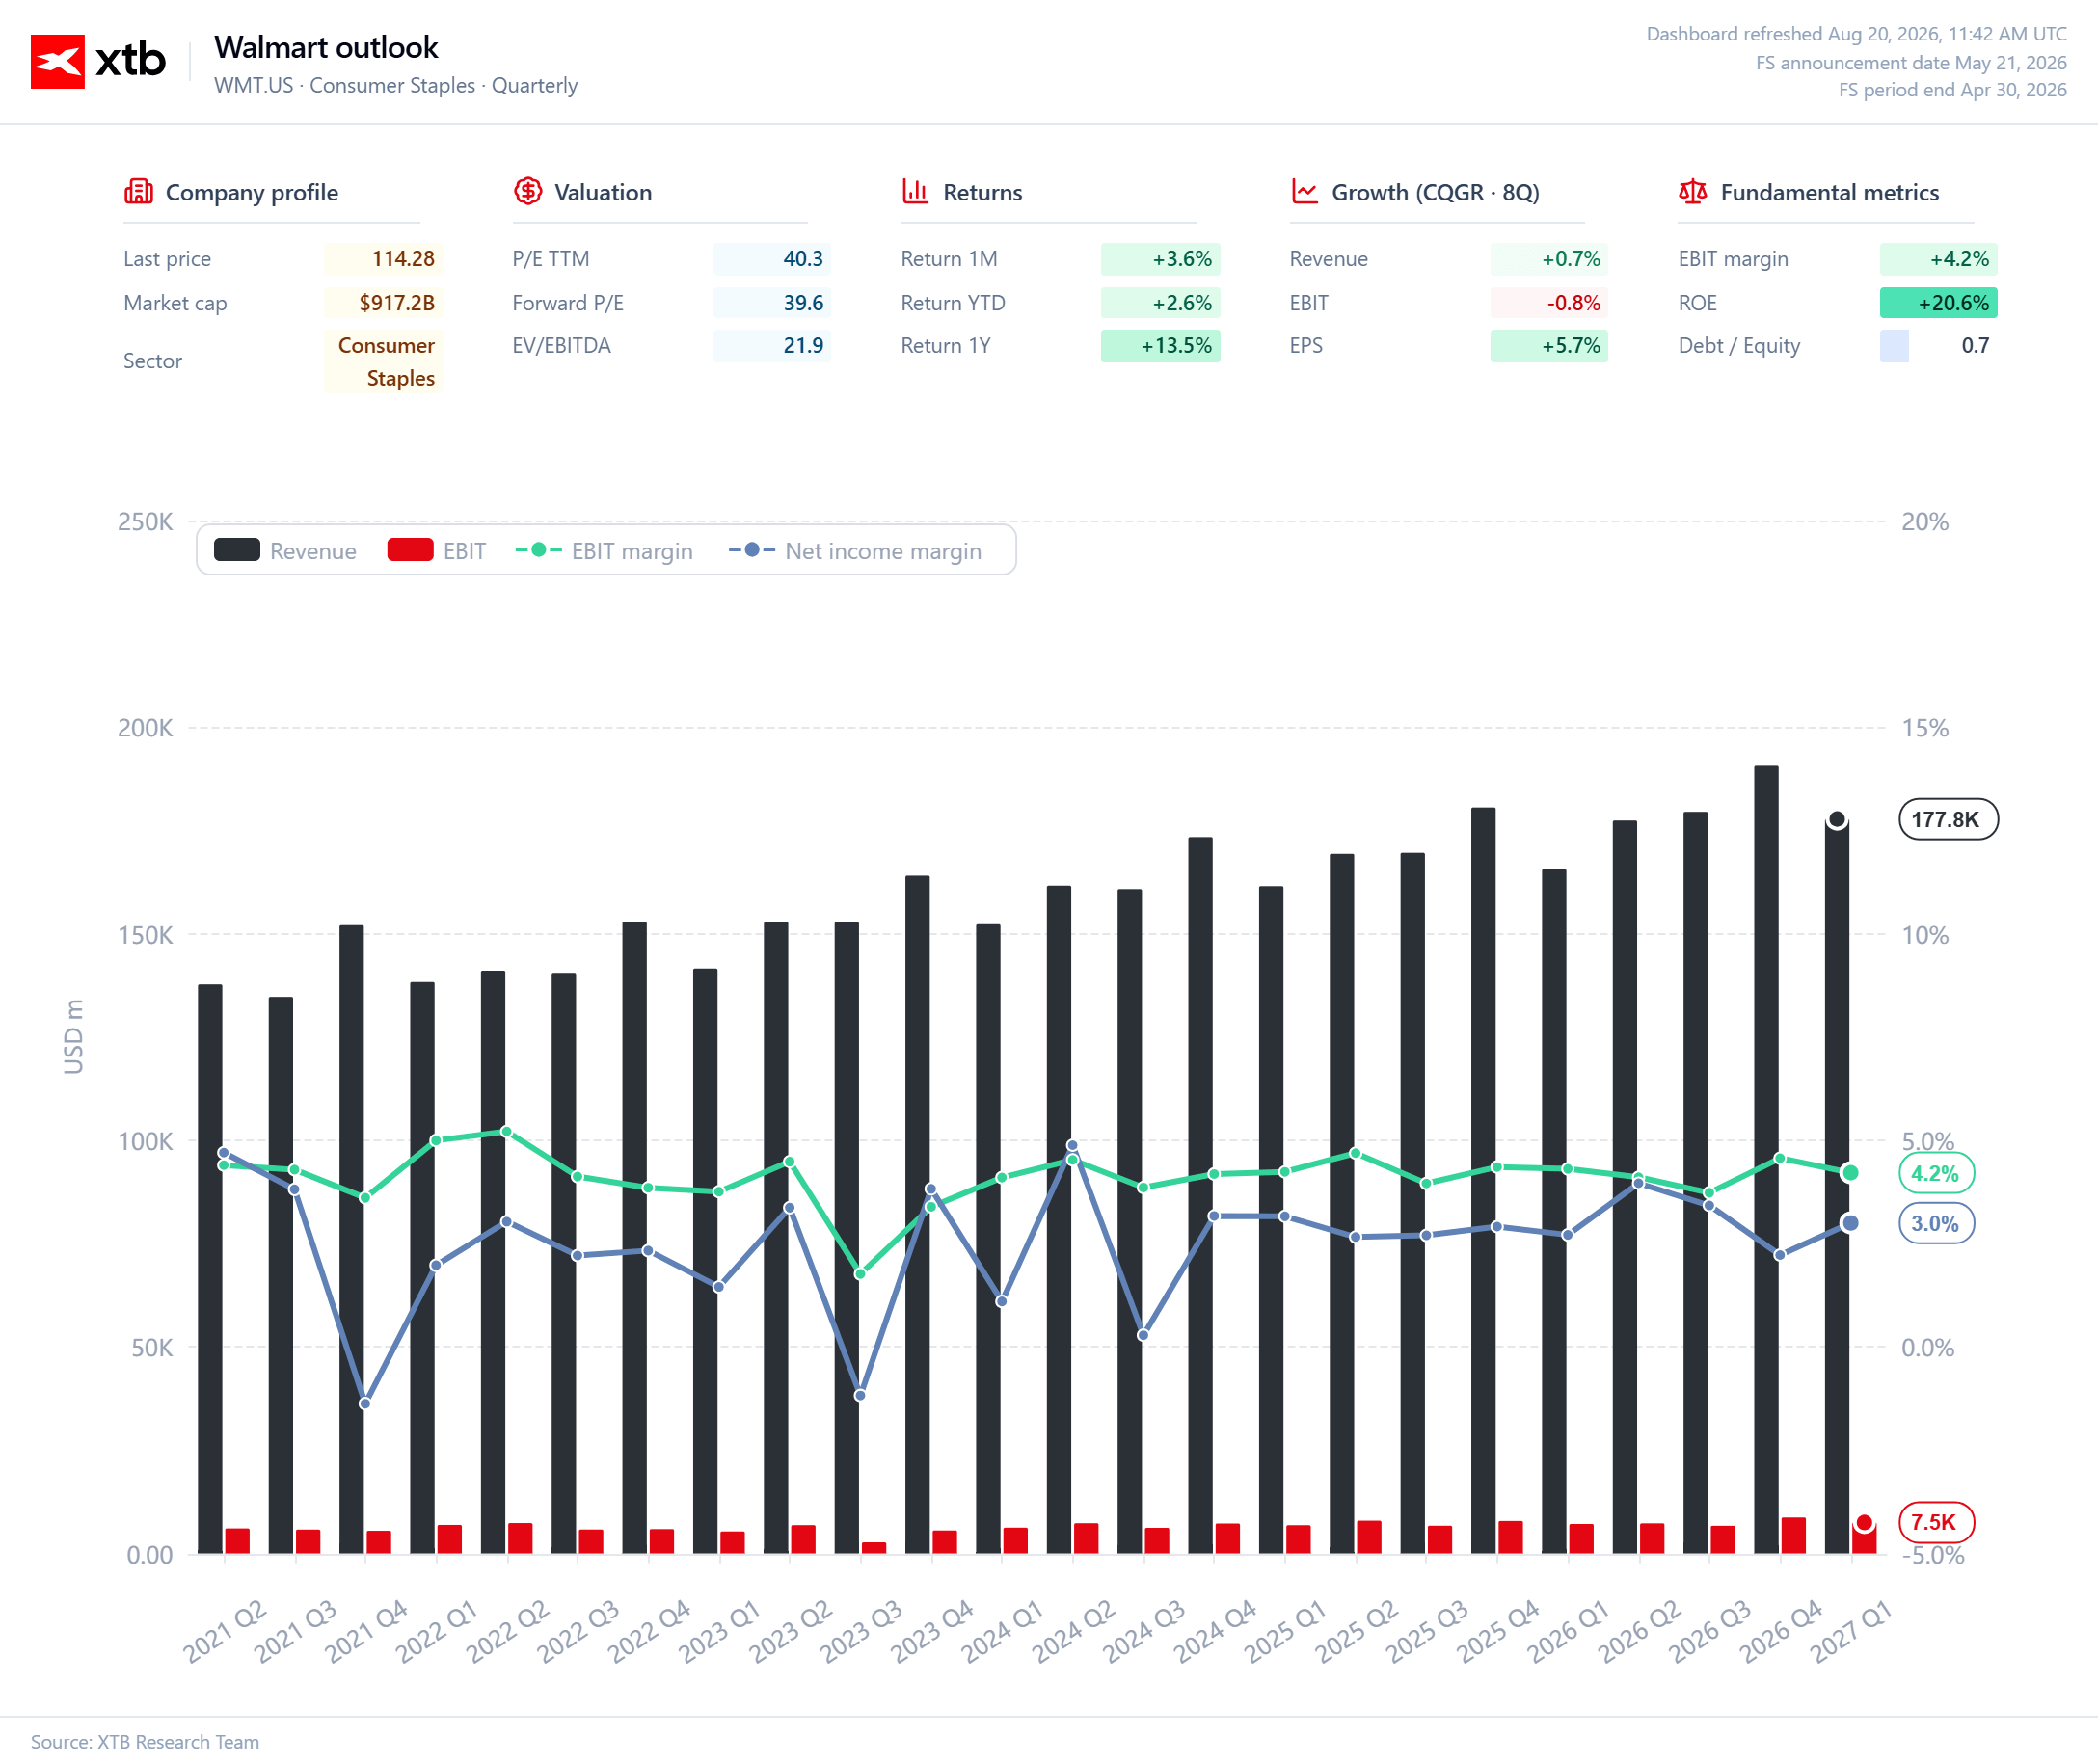
The second chart shows a business that continues to scale: quarterly revenue now stands at around $177.8 billion , compared with roughly $140–150 billion several years ago. Sales growth itself is not especially fast, however — the eight-quarter revenue CQGR is around 0.7% , reminding investors that Walmart has already reached such a large scale that double-digit organic growth for the entire group would be difficult to sustain. The key question is therefore whether each additional dollar of sales can gradually generate more profit, while the current EBIT margin of 4.2% shows how little room for error exists in mass-market retail. EBIT in the latest period stands at around $7.5 billion , while the net margin is close to 3.0% , meaning that even a few dozen basis points of sustained profitability improvement can have a major impact on the company’s value. This is where e-commerce, advertising, marketplace, and additional services may matter more than sales growth in groceries alone, because they have the potential to improve the group’s overall margin mix. One concern is that over the past eight quarters, EBIT has recorded a CQGR of around -0.8% , while EPS has grown by 5.7% , meaning that part of the improvement in earnings per share is not currently coming from pure operating profit expansion. In my view, the most important investment story for Walmart over the coming years is not revenue growth itself, but the ability to turn its enormous customer base into a slightly higher-margin business through advertising, marketplace, and logistics — even an increase in EBIT margin from 4.2% toward 5% could have a very significant impact on enterprise value.
Source: XTB Research