S&P 500 — US Large Cap Index
 FTSE 100 — UK Blue Chips
 Euro Stoxx 50 — Eurozone Leaders
 DAX 40 — German Equities
 CAC 40 — French Market Index
 Nikkei 225 — Japan Benchmark
 Hang Seng — Hong Kong Index
 Shanghai Composite — China Mainland
 ASX 200 — Australian Market
 TSX Composite — Canada Index
 Nifty 50 — India Large Cap
 STI Index — Singapore Market
 KOSPI — South Korea Index
 Bovespa — Brazil Equities
 JSE Top 40 — South Africa Index
 IPC Index — Mexico Market
What You Should Know About the Recent Declines on the Nasdaq (US100)


The US100 index (Nasdaq 100) is currently undergoing a correction following the strong rise seen in recent months, testing the support zone marked by the 100-period EMA around 28,300 points.
The downward trend in volume
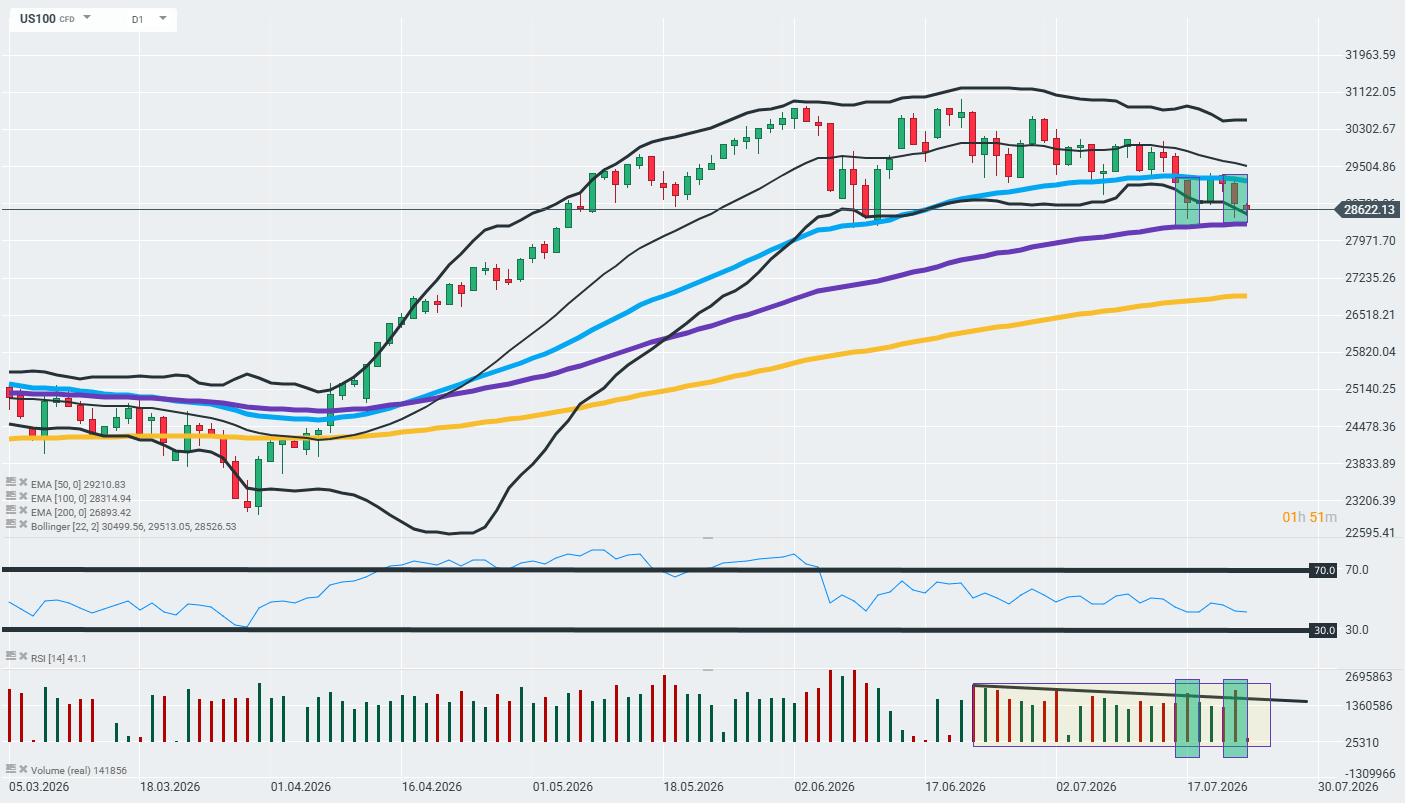
An analysis of volume on the daily chart shows that successive downward waves are occurring against a backdrop of progressively lower trading volumes. Such a ‘diminishing trajectory’ of volume within a downtrend may indicate (though it need not!) that the downward movement is not being driven by aggressive, organised institutional selling, but rather by the unwinding of long positions and profit-taking following a previous strong rally. If the declines were accompanied by rising volume, this could serve as a warning sign of a genuine trend reversal – here we have the opposite situation, which technically MAY place the correction closer to the category of a ‘mere market correction’ than the start of a deeper sell-off. However, everything could change, so it is worth exercising caution, as this form of analysis very often does not pan out perfectly, or may even lead to misleading conclusions. Source: xStation
The sessions on 17 and 23 July – signs of demand?
The exception to this downward trend are two trading sessions – 17 and 23 July – where the falls were accompanied by a sharp rise in volume, whilst the candlesticks closed with distinct long lower shadows. This combination – high volume plus a rejection of lower price levels – may be a classic sign of buying intervention in areas of local undervaluation. In other words, at the moments of greatest nervousness, the market may have found buyers ready to ‘catch’ the falls.
Valuation: P/E ratio and standard deviations
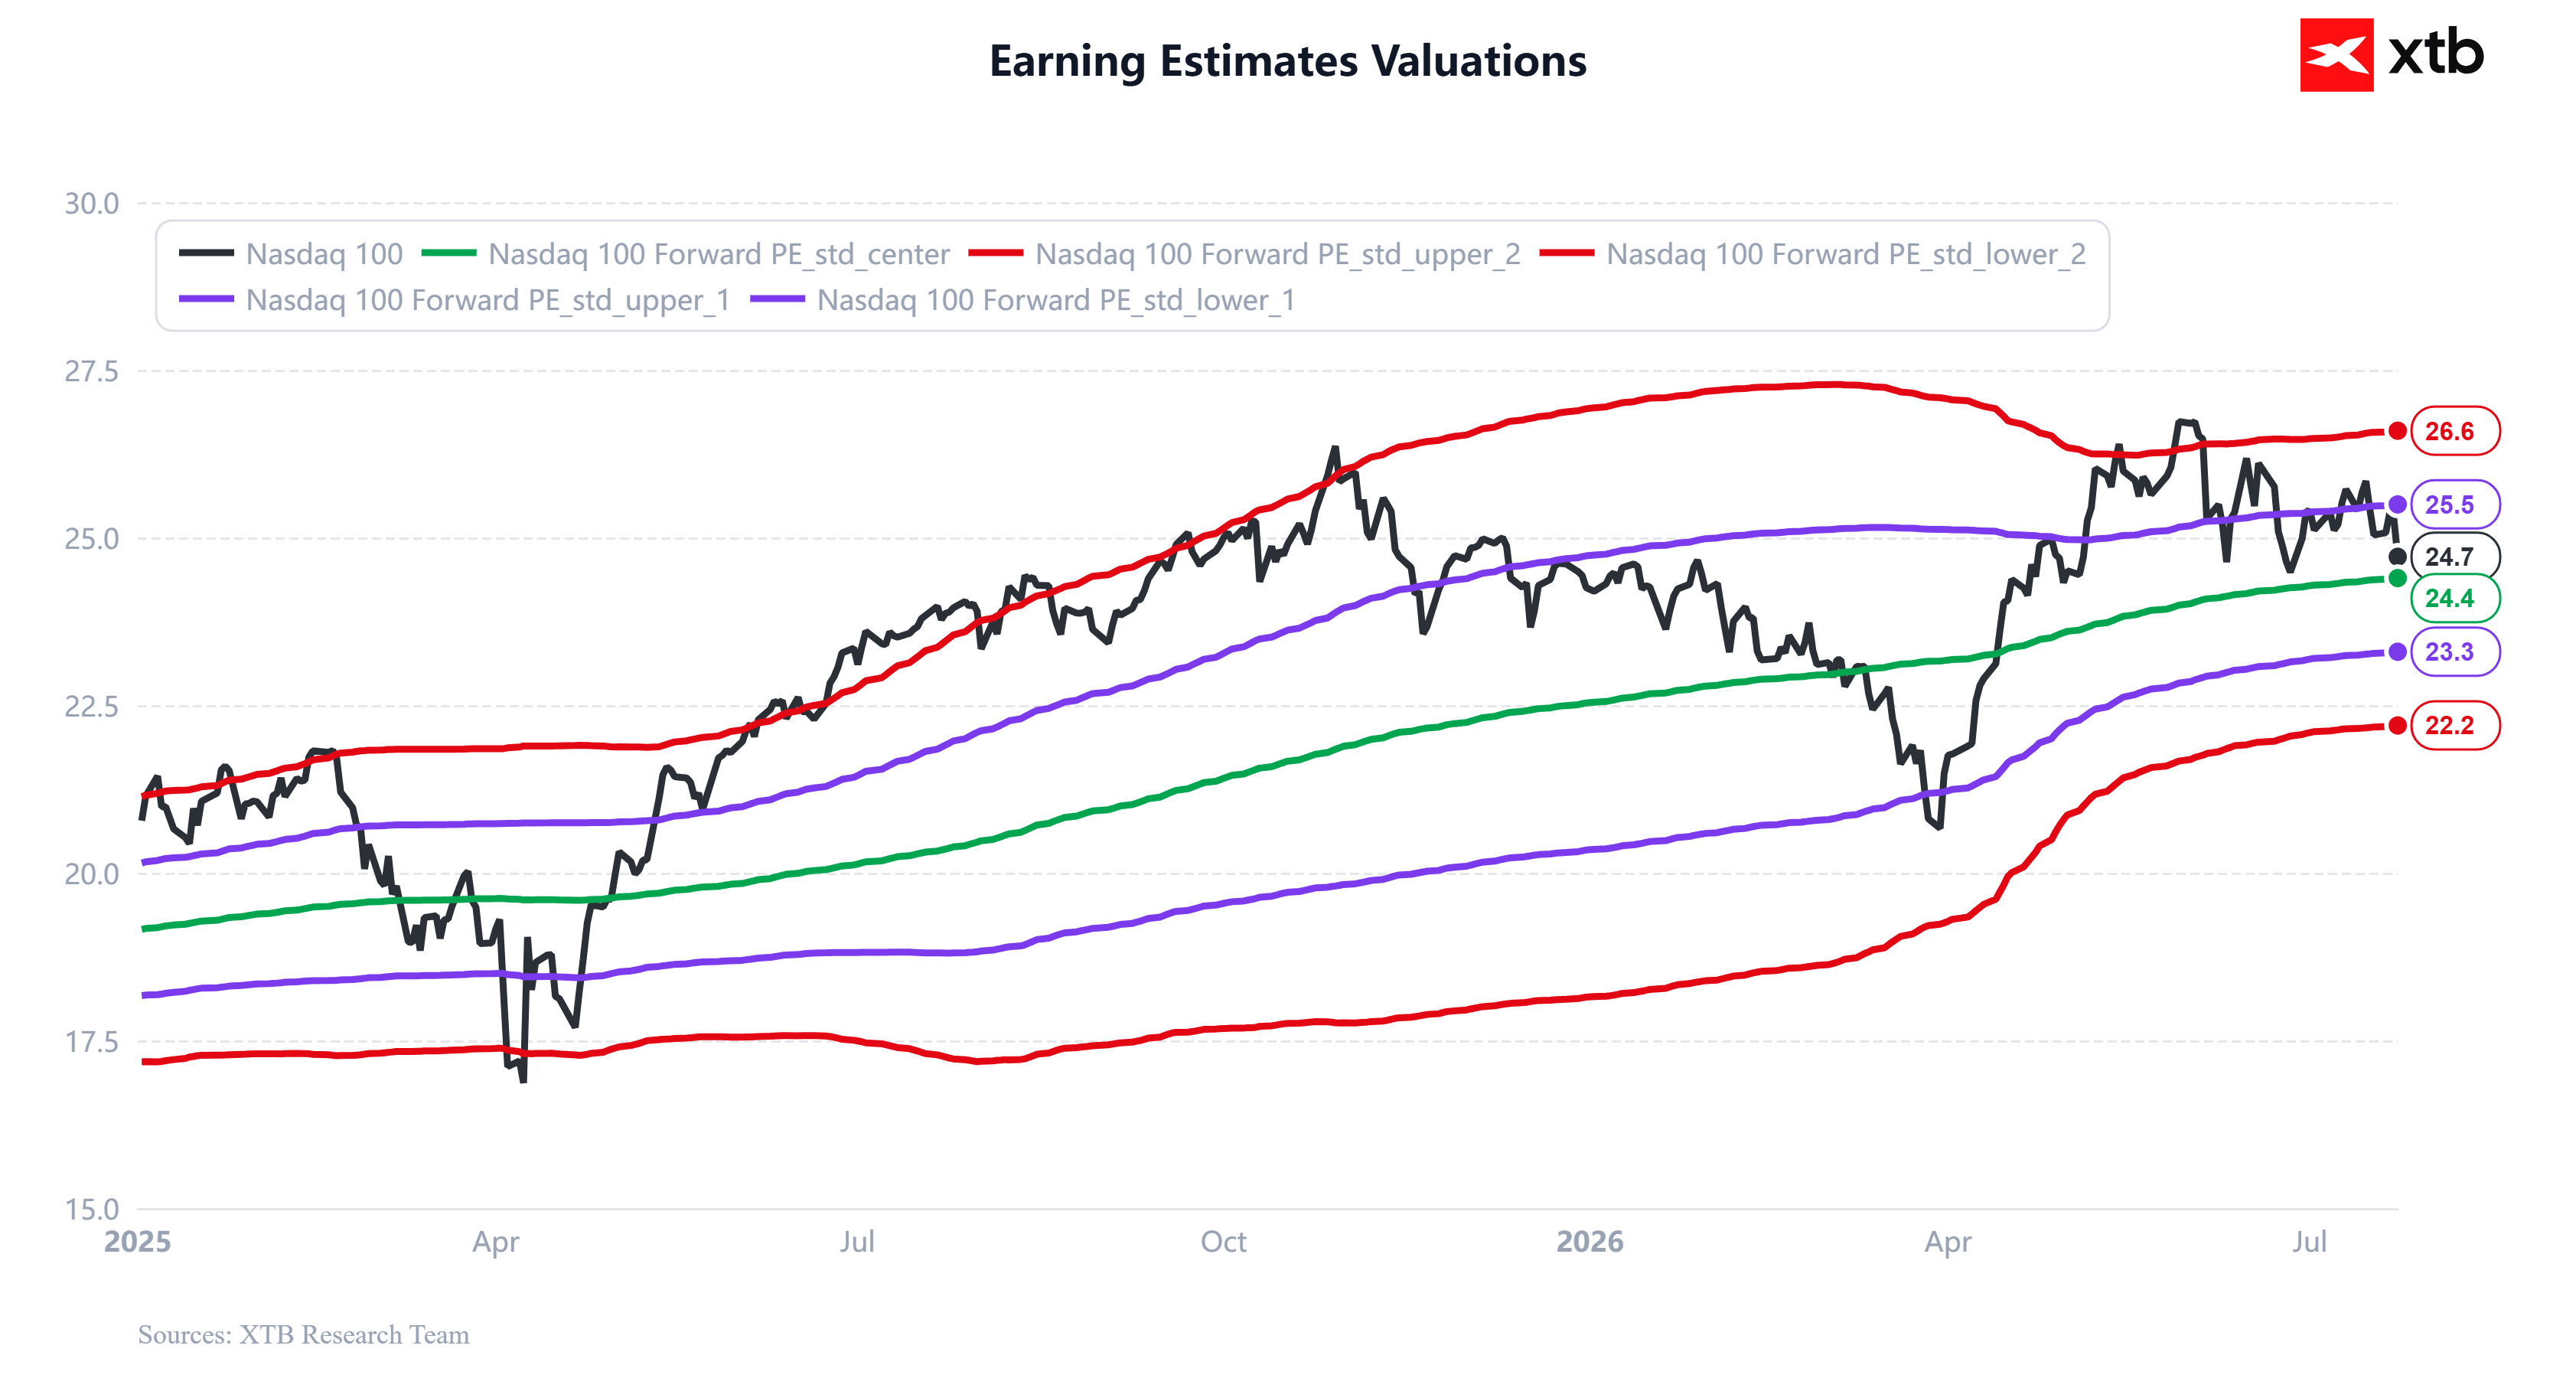
The forward P/E for the Nasdaq 100 is hovering around 24.7x, which is close to the midpoint of the long-term trend based on 256 trading days (standard deviation centre at 24.4x). Historical data show that the index’s forward P/E on an annual basis has fluctuated between around 24x and 27x, with the current reading falling within the lower half of this range. This suggests that, despite strong price growth in the first half of 2026, the market valuation is not extremely stretched relative to forecast earnings – the market is pricing in solid EPS growth rather than a pure expansion of the multiple. However, it is not excessively cheap either.