S&P 500 — US Large Cap Index
 FTSE 100 — UK Blue Chips
 Euro Stoxx 50 — Eurozone Leaders
 DAX 40 — German Equities
 CAC 40 — French Market Index
 Nikkei 225 — Japan Benchmark
 Hang Seng — Hong Kong Index
 Shanghai Composite — China Mainland
 ASX 200 — Australian Market
 TSX Composite — Canada Index
 Nifty 50 — India Large Cap
 STI Index — Singapore Market
 KOSPI — South Korea Index
 Bovespa — Brazil Equities
 JSE Top 40 — South Africa Index
 IPC Index — Mexico Market

Gold is up 1.21% today, approaching the $4,560 per ounce mark. The move is primarily driven by a weakening US dollar, with the USDIDX index down 0.30% at 98.93, accompanied by hopes of an agreement between the United States and Iran, which could lead to the opening of the Strait of Hormuz. Paradoxically, gold is not gaining today in its role as a classic safe-haven asset — rather, it is benefiting from reduced inflationary pressure from crude oil, with the Brent contract falling by 5.35%. Lower oil prices are dampening inflation expectations, which pushes back the prospect of interest rate hikes and thus supports the metal’s price.
Technical analysis
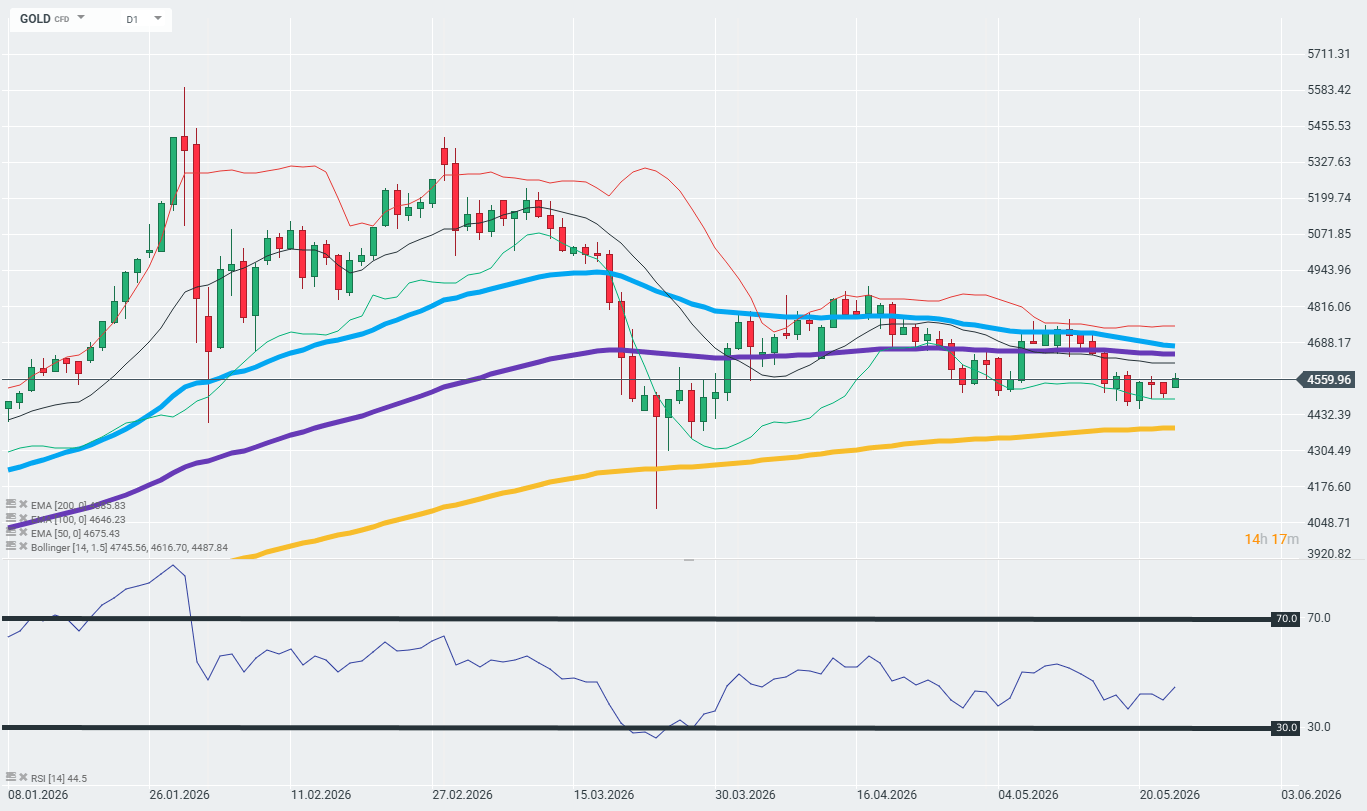
Looking at the daily chart, the technical picture remains mixed and generally unfavourable for the bulls. The price is trading below two key moving averages: the purple 100-day EMA and the blue 50-day EMA, which signal short-term and medium-term downtrends. On the other hand, the price is still holding above the 200-day EMA (the gold line), which may mean that, in the long term, the bulls are still in control. The Bollinger Bands stretch from $4,488 at the bottom to $4,745 at the top, with the midpoint at $4,617 — the price is currently hovering near the lower band, which may suggest local oversold conditions. The RSI(14) stands at 44.5, remaining in the neutral zone just below the 50 mark, indicating no overbought signal. In terms of key levels, the first support is marked by the lower Bollinger Band at $4,488, and the second by the local low from May 2026 at around $4,432. On the upside, the first resistance zone is at $4,617–$4,646, where the middle Bollinger band converges with the purple 100-day EMA, whilst the second resistance lies at $4,675–$4,688, where the blue 50-day EMA overlaps with the previous consolidation zone. The current trend can be described as sideways with a slight downward bias — following a peak of around $5,200 reached in February 2026, the price has been consolidating for over ten weeks within a range of approximately $4,400 to $4,800, systematically falling below successive moving averages. Source: xStation