S&P 500 — US Large Cap Index
 FTSE 100 — UK Blue Chips
 Euro Stoxx 50 — Eurozone Leaders
 DAX 40 — German Equities
 CAC 40 — French Market Index
 Nikkei 225 — Japan Benchmark
 Hang Seng — Hong Kong Index
 Shanghai Composite — China Mainland
 ASX 200 — Australian Market
 TSX Composite — Canada Index
 Nifty 50 — India Large Cap
 STI Index — Singapore Market
 KOSPI — South Korea Index
 Bovespa — Brazil Equities
 JSE Top 40 — South Africa Index
 IPC Index — Mexico Market

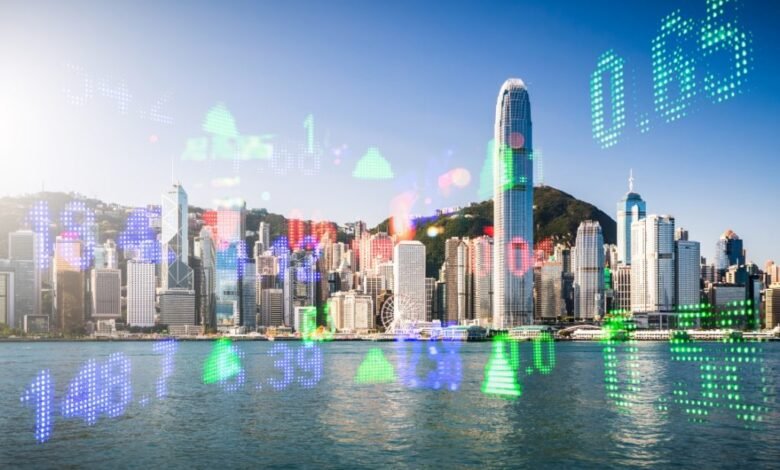
Hong Kong’s external trade activity accelerated sharply in September 2026, with imports rising 57.8% year on year to HK$808.9 billion. The increase followed a 60.0% surge in August and represented the second-strongest annual import growth since 1974, highlighting the scale of the expansion in cross-border goods flows.
The latest figures point to particularly strong demand for electrical machinery, telecommunications equipment and computing products. Imports of office machines and automatic data processing equipment increased by 142.0%, while telecommunications and sound recording equipment rose 81.7%. These categories are closely associated with technology supply chains, including the hardware infrastructure supporting artificial intelligence, data processing and digital communications.
Hong Kong’s export performance was similarly strong. Exports surged 64.9% year on year to a record HK$762.6 billion, marking the twentieth consecutive month of double-digit growth and the fastest annual increase in more than four decades, according to the supplied report.
The simultaneous acceleration in imports and exports highlights Hong Kong’s role as a major international trading and re-export hub. However, the figures also raise questions about the sustainability of the current growth pace, the concentration of trade in technology-related products and the implications for regional supply chains.
Market Snapshot
| Indicator | September 2026 |
|---|---|
| Total imports | HK$808.9 billion |
| Import growth, year on year | +57.8% |
| August import growth | +60.0% |
| Total exports | HK$762.6 billion |
| Export growth, year on year | +64.9% |
| Electrical machinery imports | +64.5% |
| Telecommunications equipment imports | +81.7% |
| Office and data-processing machinery imports | +142.0% |
| Non-ferrous metal imports | +61.3% |
| Petroleum and related products imports | +69.3% |
| Imports, January–September | +45% year on year |
Current Hong Kong Trade Performance
Hong Kong’s September trade figures show an exceptional increase in the value of goods moving through the economy. Imports reached HK$808.9 billion, while exports climbed to HK$762.6 billion, demonstrating strong activity on both sides of the trading system.
Imports increased by 57.8% compared with September last year, following growth of 60.0% in August. Although the annual growth rate eased slightly, the pace remains unusually strong by historical standards.
Exports grew even faster, rising 64.9% year on year after a 53% increase in August. The latest result marked a record monthly export value and extended Hong Kong’s run of double-digit annual export growth to 20 consecutive months.
These figures should be interpreted in the context of Hong Kong’s position as an international trading and re-export centre. Goods imported into the territory may subsequently be processed, distributed or re-exported to other markets. As a result, high import and export growth can reflect activity across wider regional and global supply chains rather than domestic consumption alone.
The key question for the coming months is whether the technology-led expansion can maintain its momentum or whether annual growth will moderate as the comparison with the previous year becomes more demanding.
AI-Related Electronics and Computing Equipment Drive Imports
Electrical machinery, telecommunications equipment and computing products were among the strongest contributors to September’s import expansion.
Imports of electrical machinery, apparatus, appliances and associated electrical parts increased by 64.5% year on year. Telecommunications and sound recording and reproducing equipment rose 81.7%, while office machines and automatic data processing equipment surged 142.0%.
These increases point to strong activity in electronics and information-technology supply chains. Demand for computing hardware, communications infrastructure and advanced electronic components can be influenced by investment in data centres, AI systems, cloud computing and digital infrastructure.
The figures are consistent with the broader importance of technology-related trade to Hong Kong’s international commercial links. However, the aggregate import data alone does not establish how much of the increase is directly attributable to AI investment, nor does it separate price effects from changes in physical shipment volumes.
For traders and businesses, the concentration of growth in technology-related categories is nevertheless significant. Continued strength in these segments could support regional manufacturers, component suppliers and logistics providers. A slowdown in technology spending or a change in inventory patterns could have the opposite effect.
Import Growth Across Supplier Markets
The expansion was broad across several of Hong Kong’s major supplier markets, although growth varied considerably by country.
| Supplier market | Import growth, year on year |
|---|---|
| South Korea | +231.1% |
| Vietnam | +118.7% |
| Thailand | +55.7% |
| Mainland China | +55.6% |
| United States | +5.9% |
| United Kingdom | +1.5% |
South Korea recorded the strongest growth among the listed suppliers, with imports rising 231.1%. Vietnam followed with an increase of 118.7%, while imports from Thailand and Mainland China increased by 55.7% and 55.6%, respectively.
The strong increases across Asian supplier markets highlight the region’s importance to Hong Kong’s goods trade. These flows may reflect demand for electronics, intermediate components, machinery and other products moving through interconnected production and distribution networks.
By comparison, imports from the United States increased by 5.9%, while those from the United Kingdom rose just 1.5%. This divergence suggests that September’s import expansion was particularly concentrated in selected Asian trading relationships.
However, annual percentage changes do not reveal the absolute value of trade with each supplier. Markets starting from a smaller base can record very high growth rates without necessarily accounting for the largest share of total imports.
Exports Surge 64.9% to a Record High
Hong Kong’s export performance provides further evidence of the strength of regional and international goods flows.
Exports reached a record HK$762.6 billion in September, up 64.9% year on year. The increase followed 53% growth in August and represented the fastest annual expansion in more than four decades, according to the supplied report.
Electrical machinery and related parts remained a major contributor, with exports increasing 66.2%. Shipments of office machines and automatic data processing equipment surged 183.7%, while telecommunications and sound recording equipment rose 67.9%.
Miscellaneous manufactured articles also recorded strong growth, increasing 56.4%.
The strength across these categories suggests that the export expansion extends beyond a single product group, although technology-related products appear particularly important to the latest figures.
A government spokesman attributed the performance to robust demand for AI-related electronic products. This points to the potential importance of investment in computing infrastructure and digital technologies, although the published aggregate figures do not quantify the precise contribution from AI-related trade.
Sustained export growth would support Hong Kong’s trading and logistics activity. Nevertheless, traders will want to establish whether the current pace reflects durable end-user demand, inventory rebuilding, shipment timing or a combination of these factors.
Asian Markets Lead Export Growth
Export growth was particularly strong across Asian destinations. Shipments to Asia increased 67.5% year on year, with several markets recording triple-digit gains.
| Export destination | Export growth, year on year |
|---|---|
| Taiwan | +159.3% |
| Malaysia | +131.5% |
| Thailand | +118.0% |
| Singapore | +77.5% |
| Mainland China | +68.1% |
| Mexico | +148.1% |
| United States | +133.4% |
Taiwan, Malaysia and Thailand recorded particularly strong increases, while exports to Singapore and Mainland China also advanced significantly. Outside Asia, shipments to Mexico and the United States rose sharply.
The breadth of the export expansion indicates that Hong Kong’s trade momentum is not confined to one destination. At the same time, the large gains across multiple technology-linked manufacturing and trading markets suggest that regional supply-chain activity is an important part of the current picture.
The next test will be whether these destinations continue to absorb Hong Kong’s shipments as the global economic outlook evolves. Changes in technology investment, consumer demand, trade policies and inventory management could influence the pace of growth.
Imports Outpace Exports in Value
Although exports recorded a faster annual growth rate, the reported September import value exceeded exports.
Imports totalled HK$808.9 billion, compared with exports of HK$762.6 billion. The difference was HK$46.3 billion.
This comparison represents the difference between the two reported monthly trade values. It should not automatically be interpreted as Hong Kong’s complete merchandise trade deficit without confirming the precise statistical definitions, coverage and accounting treatment used in the underlying releases.
The distinction matters because Hong Kong’s role as a re-export hub means that imported goods may subsequently be shipped to overseas markets. Import and export values can also differ because of timing, product composition and valuation conventions.
The combined surge in imports and exports is therefore more immediately indicative of elevated trading activity than of a standalone conclusion about economic strength or weakness.
Imports Rise 45% During the First Nine Months
Hong Kong’s imports were 45% higher in January–September 2026 than during the corresponding period a year earlier.
This cumulative increase suggests that the September surge forms part of a broader period of strong annual growth rather than representing an isolated monthly movement.
The trend is important for companies involved in international logistics, freight, warehousing, distribution and cross-border payments. Sustained trade growth can increase transaction volumes and working-capital requirements throughout the supply chain.
However, a 45% increase in the value of imports does not necessarily mean that physical shipment volumes have increased by the same amount. Changes in product prices, the mix of goods traded, shipment timing and the value of high-priced electronic equipment may all affect the reported totals.
Future monthly releases will help establish whether the expansion is broadening across additional sectors or remains concentrated in technology and selected manufacturing categories.
Bullish Sentiment
- Exceptional import growth. September imports rose 57.8% year on year, indicating strong activity in Hong Kong’s international goods trade.
- Record export value. Exports reached HK$762.6 billion, supported by substantial growth across electronics, computing equipment and telecommunications products.
- Technology-related demand. Strong increases in office machinery, data-processing equipment and electrical products are consistent with robust activity in technology supply chains.
- Broad regional participation. Strong trade growth across South Korea, Vietnam, Thailand, Mainland China and several export destinations suggests that the expansion is not limited to one trading partner.
- Sustained cumulative growth. Imports increased 45% over the first nine months of 2026, pointing to an extended period of strong annual trade expansion.
Bearish Sentiment
- Growth may moderate from exceptional levels. Annual increases above 50% are difficult to sustain indefinitely, particularly as comparison periods become more demanding.
- Technology concentration creates exposure. If AI-related investment, electronics demand or inventory accumulation slows, Hong Kong’s trade momentum could weaken.
- Annual growth does not confirm equivalent volume growth. Changes in prices, product mix and shipment values may account for part of the reported increase.
- Import values exceed export values. The September figures show a HK$46.3 billion difference between imports and exports, although the precise trade-balance implications require confirmation of the statistical definitions.
- External demand remains important. Hong Kong’s trading activity is exposed to changes in global economic conditions, trade policy, supply-chain organisation and investment spending.
Hong Kong Trade Outlook and Economic Forecast
Hong Kong’s September trade performance points to continued strength in cross-border goods flows, particularly in electronics, telecommunications and computing equipment. The simultaneous acceleration in imports and exports suggests that regional supply chains and demand for technology-related products remain important drivers of activity.
Bullish outlook
Trade momentum could remain strong if demand for AI infrastructure, computing hardware and electronic components continues to expand. Further increases in shipments to major Asian markets and sustained export growth would reinforce the view that Hong Kong is benefiting from strong regional trade activity.
If the January–September import trend continues, logistics providers, distributors and businesses supporting international goods flows could experience sustained demand.
Bearish outlook
Trade growth could slow if technology investment moderates, global demand weakens or buyers reduce inventories after a period of strong purchasing. Changes in trade policy or disruptions to international supply chains could also affect shipment volumes and commercial confidence.
The unusually high annual growth rates also warrant caution when assessing momentum. A lower year-on-year growth rate in subsequent months would not necessarily mean trade values were falling; it could instead reflect a higher comparison base.
Key indicators to watch
- Monthly Hong Kong import and export values.
- Shipments of electrical machinery, computing equipment and telecommunications products.
- Trade performance with Mainland China and other major Asian markets.
- Evidence of sustained demand for AI-related hardware.
- Changes in global technology investment and inventory levels.
- The relationship between import values, export values and the wider trade balance.
Market Outlook for the Coming Sessions
Hong Kong’s September trade data provides a strong signal of elevated international trading activity, with imports rising 57.8% and exports advancing 64.9% year on year. The record export value and sharp growth in technology-related goods underline the importance of electronics and computing products to the current expansion.
The outlook will depend on whether demand across regional technology supply chains remains strong and whether the latest figures translate into sustained trade activity in the final quarter of 2026.
For now, the data supports a positive assessment of Hong Kong’s trade momentum, but the extraordinary growth rates should not be extrapolated indefinitely. Subsequent releases will be important for distinguishing durable demand from temporary shipment effects, changes in inventories and price-related influences.
Businesses should also recognise that stronger trade activity can increase exposure to exchange-rate movements, payment timing and working-capital requirements, particularly when transactions involve suppliers and customers across several currencies.
Currency Hedger View
Strong trade flows can create opportunities for Hong Kong-based importers, exporters, distributors and international trading companies, but higher transaction values can also increase foreign-exchange exposure.
An importer purchasing electronic components or machinery in US dollars may face a different cost in Hong Kong dollars if exchange rates move before payment is settled. Exporters receiving foreign-currency revenue may also experience changes in the value of receipts when converting funds into their operating currency.
Businesses with growing cross-border trade should consider mapping expected payments and receipts, identifying currency mismatches and assessing how exchange-rate changes could affect margins and cash flow.
Currency Hedger helps businesses explore foreign-exchange risk-management considerations associated with international transactions. Companies can open an account to discuss their cross-border payment requirements and currency exposure.
Disclaimer
This article is provided for informational and market commentary purposes only. It does not constitute investment, financial or trading advice, or a recommendation to buy or sell any financial instrument. Trade statistics describe reported values and do not necessarily represent equivalent changes in physical volumes or future economic performance. Forecasts and interpretations are subject to uncertainty and may change as new data becomes available. Businesses and investors should conduct independent research and seek appropriate professional advice before making financial or commercial decisions.