- Silver breaks below $60.00 this week, confirming a deeper bearish technical damage.
- RSI exits oversold territory, but sellers remain firmly in control.
- Break below $55.63 exposes $54.39 and $50.00 supports.
Silver (XAG/USD) price registers gains of nearly 2% on Friday but is poised to finish the week with losses of nearly 10%, as the white metal falls below the $60.00 threshold for the first time since the rally that began at the beginning of December 2025. At the time of writing, the XAG/USD pair trades at $59.00 after hitting a low of $55.70.
XAG/USD Price Forecast: Technical outlook
The white metal has enjoyed quite a reversal and, so far, has fallen nearly 22% in June. After reaching a record high of $121.66 per troy ounce in January, Silver has lost its luster due to several reasons.
The higher-for-longer scenario of interest rates, with major central banks set to hold or hike rates, exerts downward pressure on Silver. Although it’s posting daily gains, XAG is tilted to the downside.
The Relative Strength Index (RSI) shows that sellers are in charge, even though the index has been back above 30 after being overbought for three days.
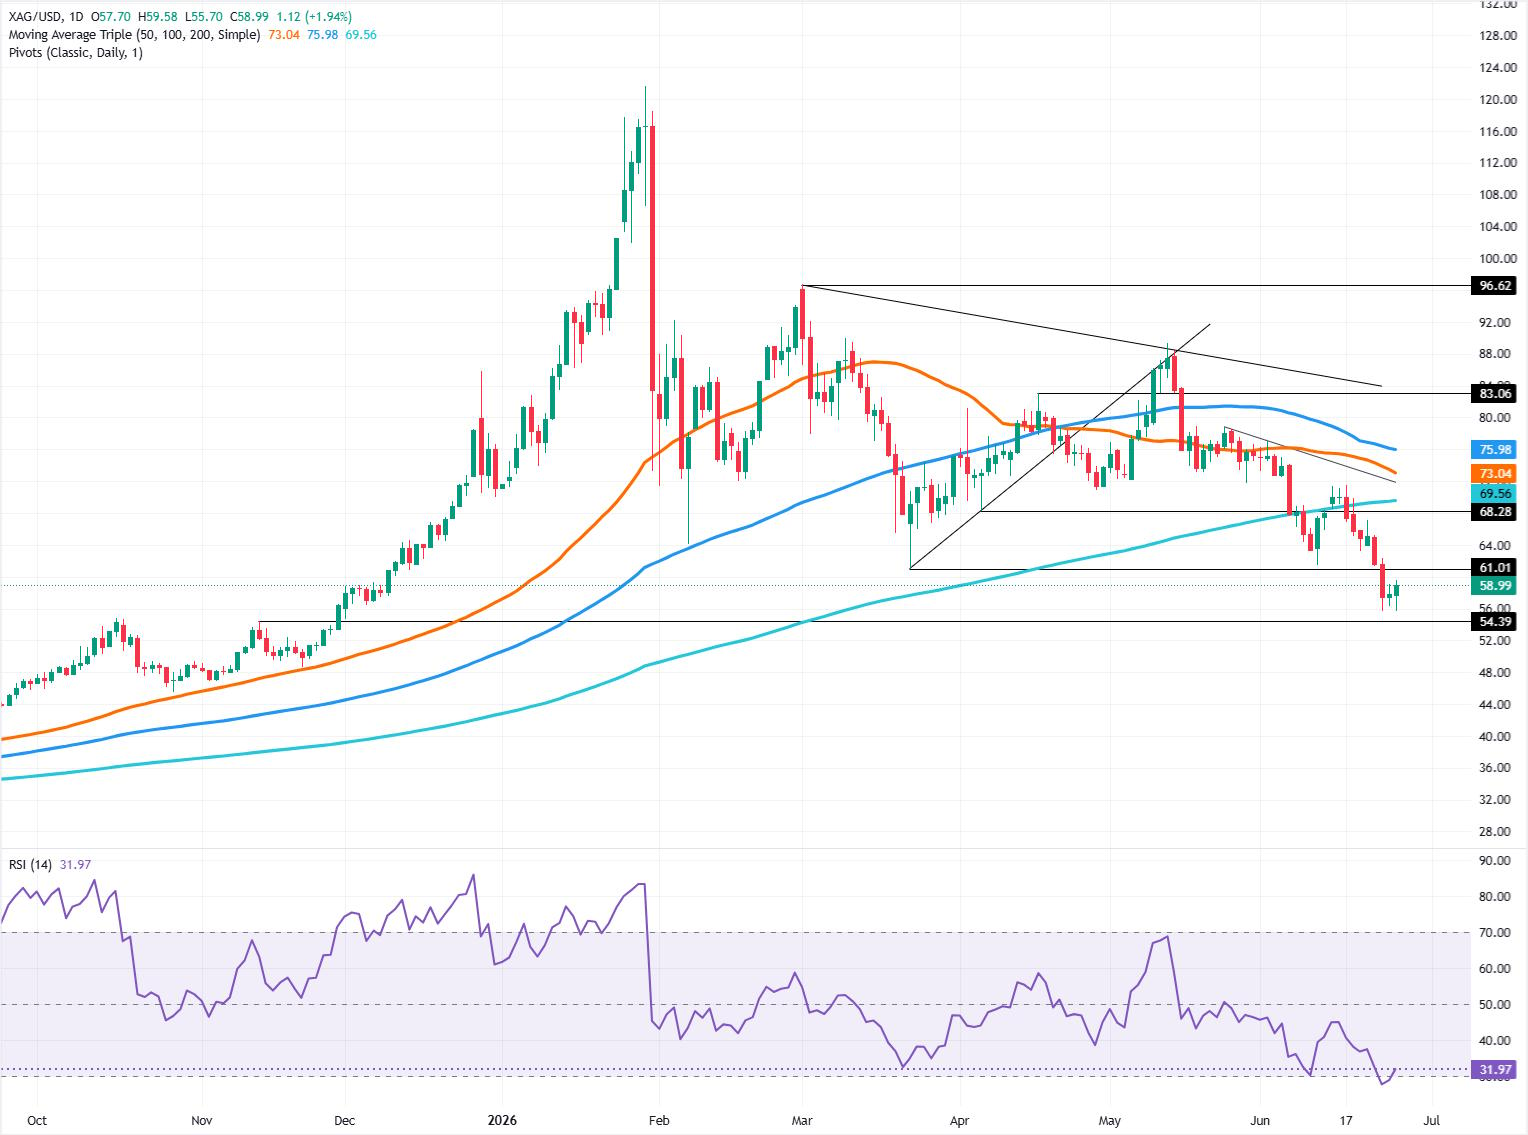
Given the backdrop, the path of least resistance is downwards. The first support for XAG/USD would be the June 24 swing low of $55.63. Once cleared, the next stop would be the November 13, 2025, cycle high-turned-support at $54.39, ahead of the $50.00 mark.
For a bullish resumption, buyers must clear the $60.00 mark, followed by the 200-day Simple Moving Average (SMA) at $69.56.
XAG/USD Price Chart – Daily