S&P 500 — US Large Cap Index
 FTSE 100 — UK Blue Chips
 Euro Stoxx 50 — Eurozone Leaders
 DAX 40 — German Equities
 CAC 40 — French Market Index
 Nikkei 225 — Japan Benchmark
 Hang Seng — Hong Kong Index
 Shanghai Composite — China Mainland
 ASX 200 — Australian Market
 TSX Composite — Canada Index
 Nifty 50 — India Large Cap
 STI Index — Singapore Market
 KOSPI — South Korea Index
 Bovespa — Brazil Equities
 JSE Top 40 — South Africa Index
 IPC Index — Mexico Market

Facts:
- The price is currently trading above the EMA50 (29,301.49), the EMA100 (28,644.80) and the EMA200 (27,326.57).
- The RSI(14) indicator remains at 50.4.
Recommendation: Long position in US100 at market price Stop Loss: 28 445 Take Profit: 30 500
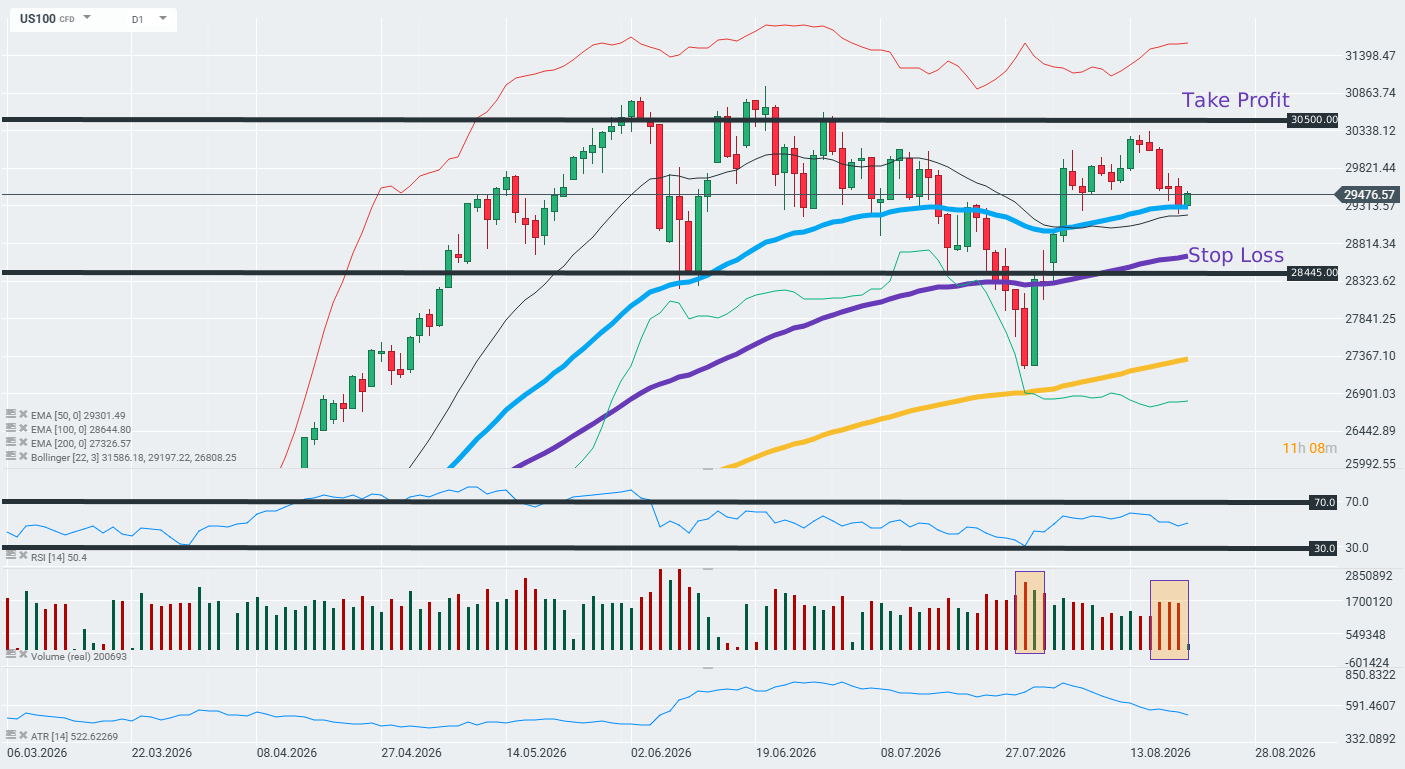
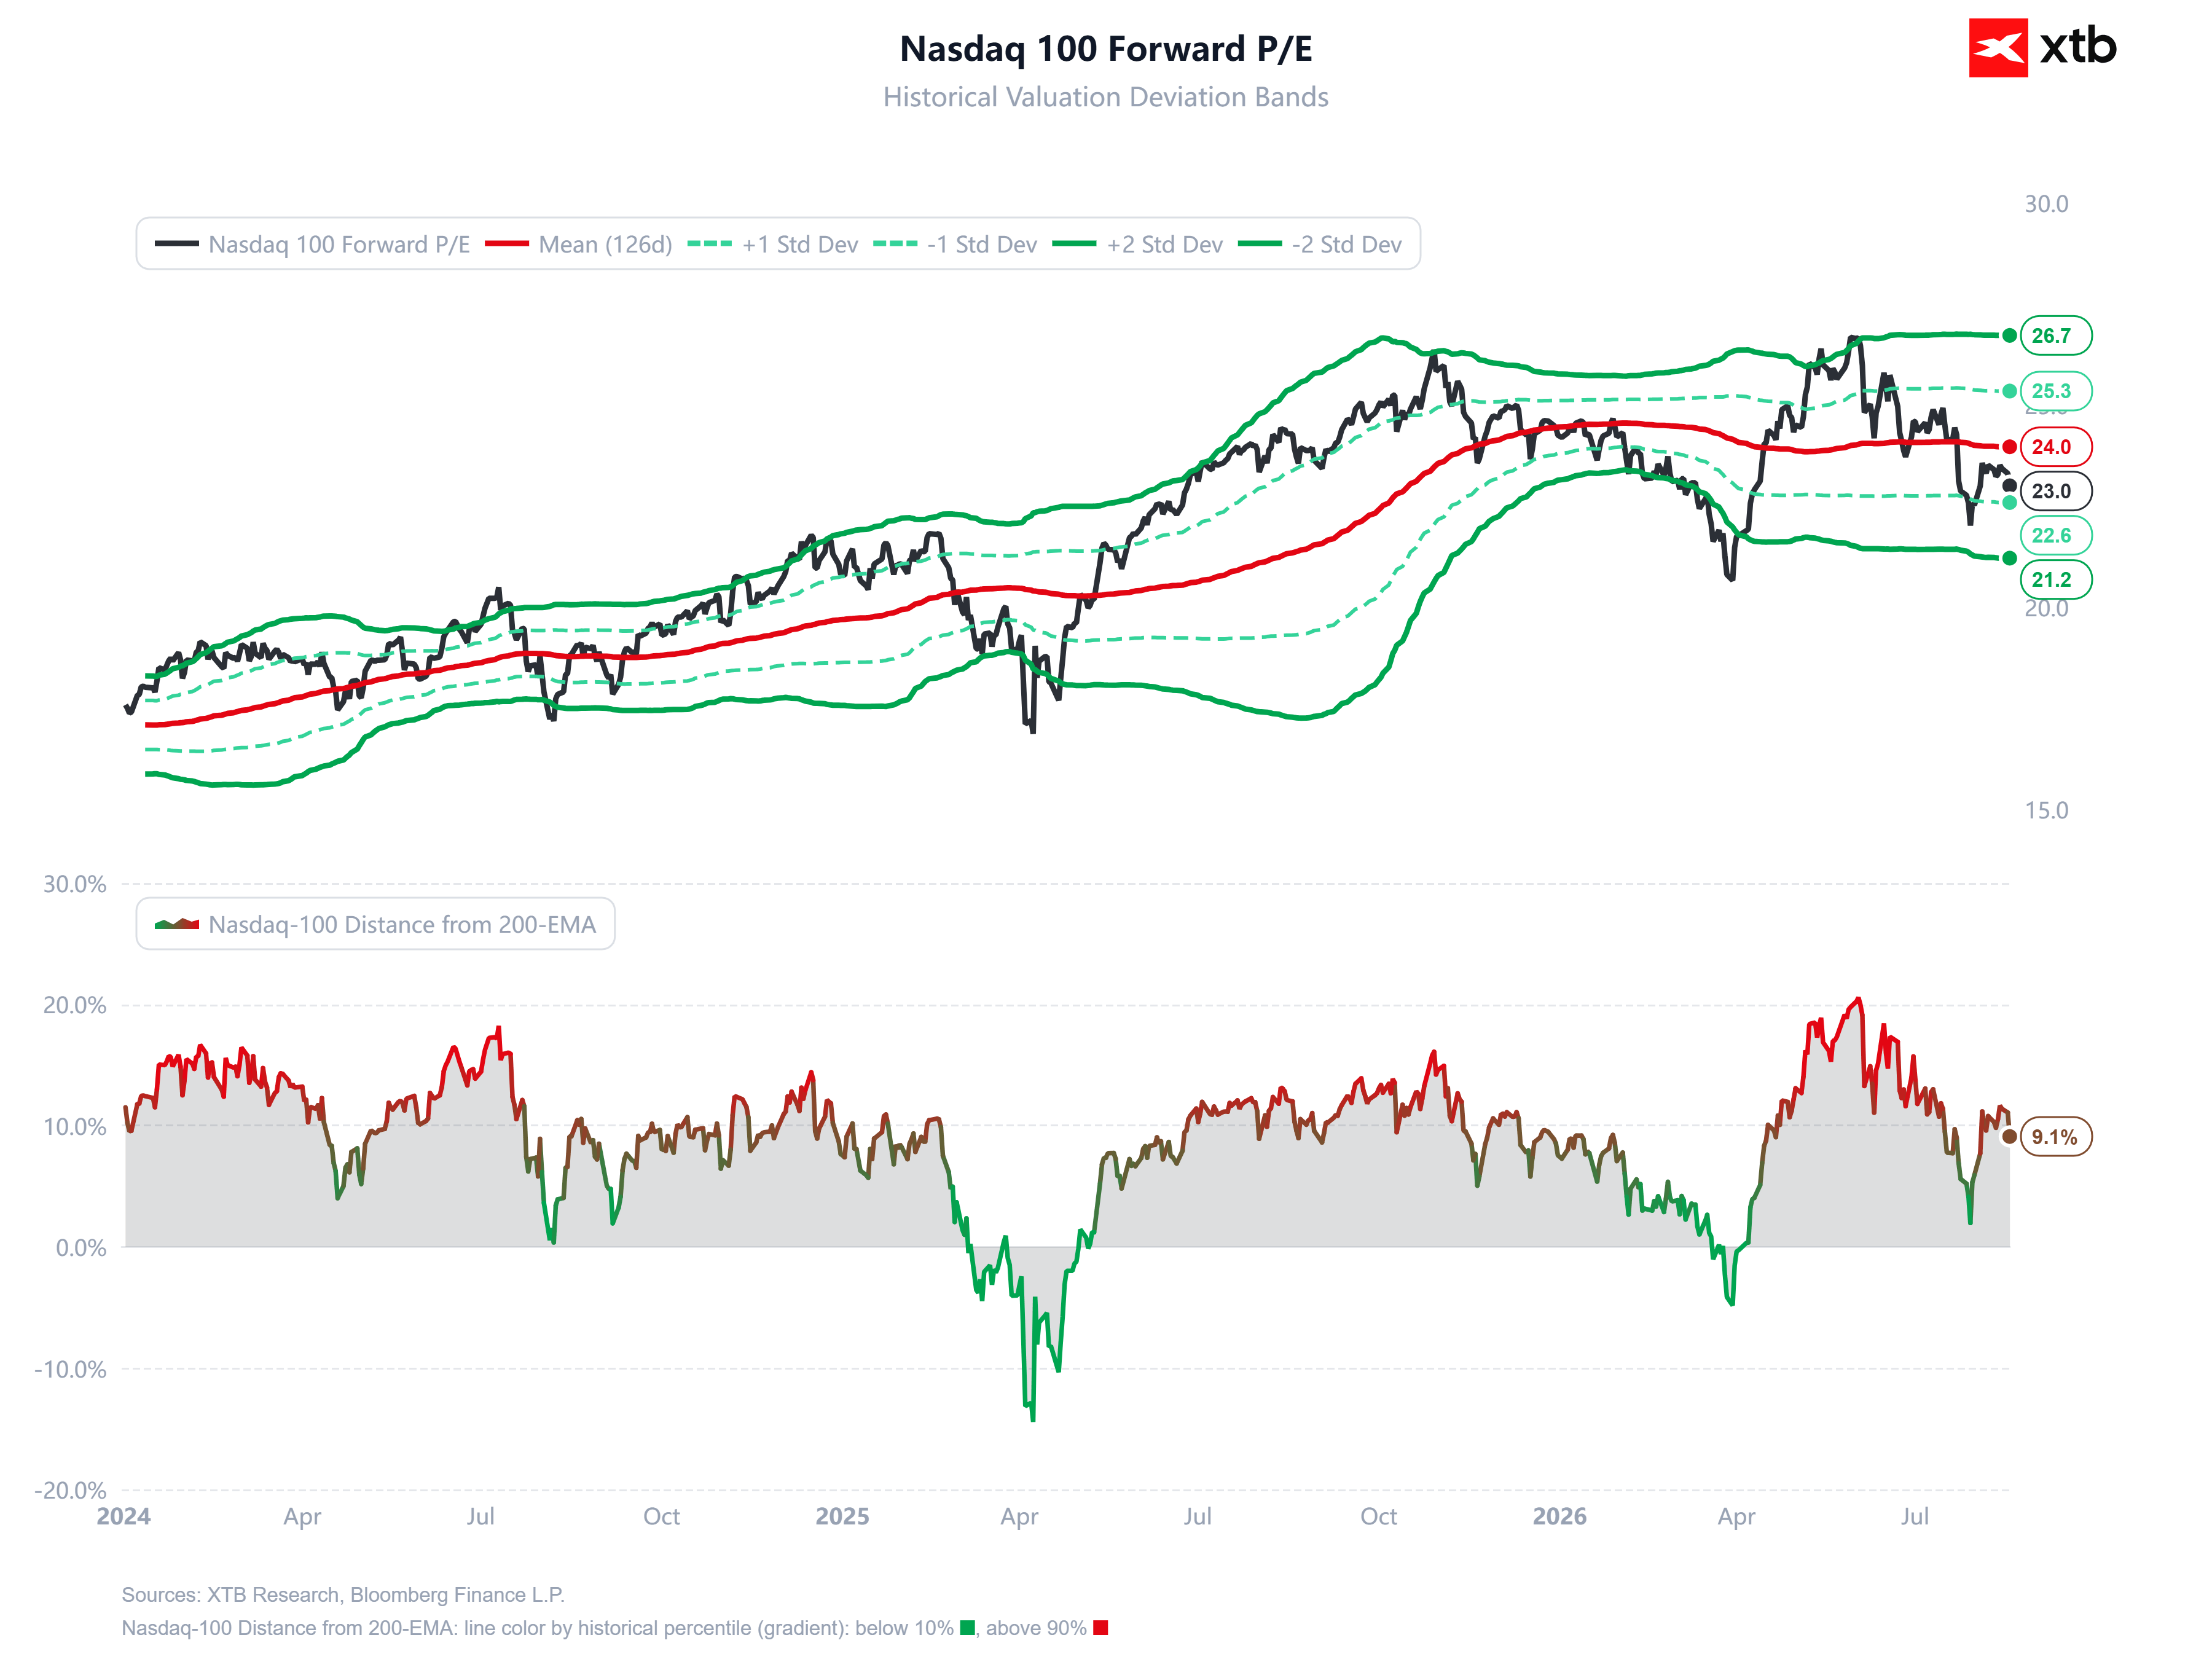
Opinion: The recommendation to go long on the US100, with a target (take profit) around 30,500 points and a stop loss at 28,445 points, is based on a combination of technical analysis and fundamental arguments. On the daily chart, the price is trading above the EMA50, EMA100 and EMA200 moving averages, which are forming a clear uptrend, whilst the RSI (14) at around 50.4 indicates that the market is neither overbought nor oversold, leaving room for further gains without any reversal signals. Furthermore, the most recent downward move ended at the 50-day EMA, which may indicate the market’s willingness to maintain the current uptrend. From a fundamental perspective, the index is not expensive. The forward P/E ratio on a comparative scale from 2024 onwards shows that the index is currently trading below one negative standard deviation, even though the distance from the 200-day EMA fluctuates around slightly elevated values of the normal distribution within the same historical range. This situation may indicate that the valuation is not keeping pace with the growth in earnings generated by the companies comprising the Nasdaq 100 index (see appendix below). Methodology and assumptions: The recommendation was based on a technical and fundamental analysis of the US100 chart. Classical technical analysis was used to assess the situation and analyse the trend. Essential appendices: