S&P 500 — US Large Cap Index
 FTSE 100 — UK Blue Chips
 Euro Stoxx 50 — Eurozone Leaders
 DAX 40 — German Equities
 CAC 40 — French Market Index
 Nikkei 225 — Japan Benchmark
 Hang Seng — Hong Kong Index
 Shanghai Composite — China Mainland
 ASX 200 — Australian Market
 TSX Composite — Canada Index
 Nifty 50 — India Large Cap
 STI Index — Singapore Market
 KOSPI — South Korea Index
 Bovespa — Brazil Equities
 JSE Top 40 — South Africa Index
 IPC Index — Mexico Market

- USD/JPY rises to near 167.73 as US Treasury Yields soar, following upbeat US JOLTS Job Openings data.
- Investors shift their focus to the US ADP Employment Change and the ISM Manufacturing PMI data for June.
- Japan’s officials have signaled that they are ready to intervene to support the Yen.
The USD/JPY pair trades 0.1% higher to near 162.73 during the European trading session on Wednesday. The pair reflects strength as surging United States (US) Treasury Yields have strengthened the US Dollar (USD).
In the European trade, 10-year US Treasury Yields are up 0.18% to 4.47%, extending Tuesday’s little over 2% gains. The US Dollar Index (DXY), which tracks the Greenback’s value against six major currencies, is up 0.16% to near 101.33.
US Dollar Price Today
The table below shows the percentage change of US Dollar (USD) against listed major currencies today. US Dollar was the strongest against the Australian Dollar.
| USD | EUR | GBP | JPY | CAD | AUD | NZD | CHF | |
|---|---|---|---|---|---|---|---|---|
| USD | 0.12% | 0.14% | 0.08% | 0.10% | 0.36% | 0.02% | 0.05% | |
| EUR | -0.12% | 0.02% | -0.04% | -0.01% | 0.26% | -0.11% | -0.05% | |
| GBP | -0.14% | -0.02% | -0.06% | -0.03% | 0.22% | -0.13% | -0.05% | |
| JPY | -0.08% | 0.04% | 0.06% | 0.00% | 0.29% | -0.09% | -0.01% | |
| CAD | -0.10% | 0.01% | 0.03% | -0.01% | 0.27% | -0.11% | -0.02% | |
| AUD | -0.36% | -0.26% | -0.22% | -0.29% | -0.27% | -0.37% | -0.29% | |
| NZD | -0.02% | 0.11% | 0.13% | 0.09% | 0.11% | 0.37% | 0.09% | |
| CHF | -0.05% | 0.05% | 0.05% | 0.01% | 0.02% | 0.29% | -0.09% |
The heat map shows percentage changes of major currencies against each other. The base currency is picked from the left column, while the quote currency is picked from the top row. For example, if you pick the US Dollar from the left column and move along the horizontal line to the Japanese Yen, the percentage change displayed in the box will represent USD (base)/JPY (quote).
US bond yields are soaring due to signs of improving US job market conditions. On Tuesday, the US JOLTS Job Openings data for May arrived at 7.594 million fresh jobs, higher than 7.3 million estimates and the previous reading of 7.585 million.
Meanwhile, investors await the US ADP Employment Change and the ISM Manufacturing PMI data for June, which will be released during the North American session.
On the Tokyo front, investors expect the Japanese administration to intervene anytime soon to support the falling Japanese Yen (JPY). On Tuesday, Japan’s Chief Cabinet Secretary Minoru Kihara said that the administration is always ready to take necessary action on Forex; however, he didn’t deliver any comments regarding specific FX levels.
USD/JPY technical analysis
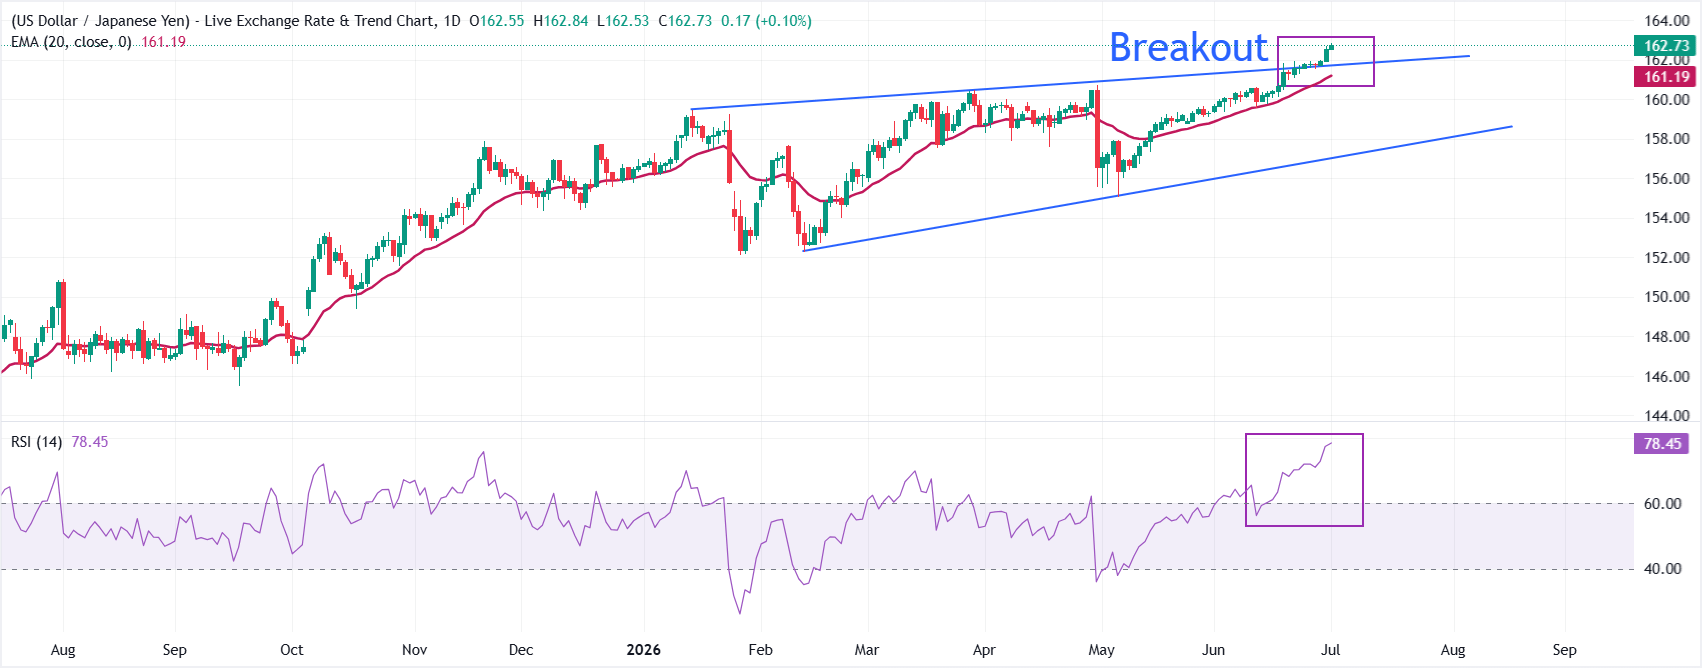
USD/JPY trades higher at around 162.73, extending its bullish bias as spot holds well above the 20-day exponential moving average (EMA) at 161.19. The overall trend of the pair is bullish, following the breakout of the Rising Channel formation.
The Relative Strength Index (RSI) at 78.45 sits deep in overbought territory, suggesting upside momentum remains strong but also warns that the pair could be vulnerable to bouts of corrective pullback even within the broader uptrend.
On the downside, immediate support is seen at the Rising Channel breakout region near 161.75, followed by the 20-day EMA near 161.19. Looking up, the pair could extend the rally towards 163.00 and 164.00.