S&P 500 — US Large Cap Index
 FTSE 100 — UK Blue Chips
 Euro Stoxx 50 — Eurozone Leaders
 DAX 40 — German Equities
 CAC 40 — French Market Index
 Nikkei 225 — Japan Benchmark
 Hang Seng — Hong Kong Index
 Shanghai Composite — China Mainland
 ASX 200 — Australian Market
 TSX Composite — Canada Index
 Nifty 50 — India Large Cap
 STI Index — Singapore Market
 KOSPI — South Korea Index
 Bovespa — Brazil Equities
 JSE Top 40 — South Africa Index
 IPC Index — Mexico Market

Key takeaways
- Divergent sentiment in commodity markets: The commodity sector is characterized by a slight prevalence of declines, while precious and industrial metals maintain strong, historical upward trends.
- Situation in the natural gas market (Natgas): Quotes are under pressure from forecasts of higher temperatures and a delay in the US heating season, despite high demand for electricity.
- Impact of geopolitics on crude oil: Oil prices are reacting with high volatility to reports from the Middle East, tensions surrounding Iran, and changes in the volume of exports through the Strait of Hormuz.
- Supply and demand balance in cotton and cocoa: The cotton market is feeling the effects of lower USDA harvest forecasts, while cocoa is struggling with high exchange inventories and fluctuations in supply from West Africa.
Market Situation
- The second session of the last full week of September in commodity markets brings a moderate mix of sentiment, with a slight bias toward negative changes and a daily average of -0.09%.
- Agricultural and livestock commodities performed best on a daily basis, led by orange juice (+4.33%) and live cattle (+2.02%). On the other hand, precious metals and selected agricultural commodities came under the strongest selling pressure, reflecting a 2.03% decline in silver and a 1.95% drop in EU sugar.
- Despite ongoing corrections, the long-term price structure for industrial and precious metals remains tilted heavily upward.
- Extreme statistical deviations (Z-score above 1.5σ) are recorded for copper (+2.87σ), zinc (+2.02σ), as well as gold and silver, indicating a strong, historical upward trend in this segment.
- A contrasting situation is seen in the livestock sector, where lean hogs, despite a daily rebound, remain deeply below their multi-year average (-1.75σ).
- The macroeconomic context is heavily marked by geopolitical tensions in the Middle East and concerns over energy commodity supplies.
- Threats of sanctions against Iranian airlines and rising oil and gas prices are boosting inflation fears in Europe, which translates directly into commodity valuations and broader market behavior.
- In the near term, investors should closely monitor geopolitical developments around oil transit routes and central bank reactions to sustained cost pressures.
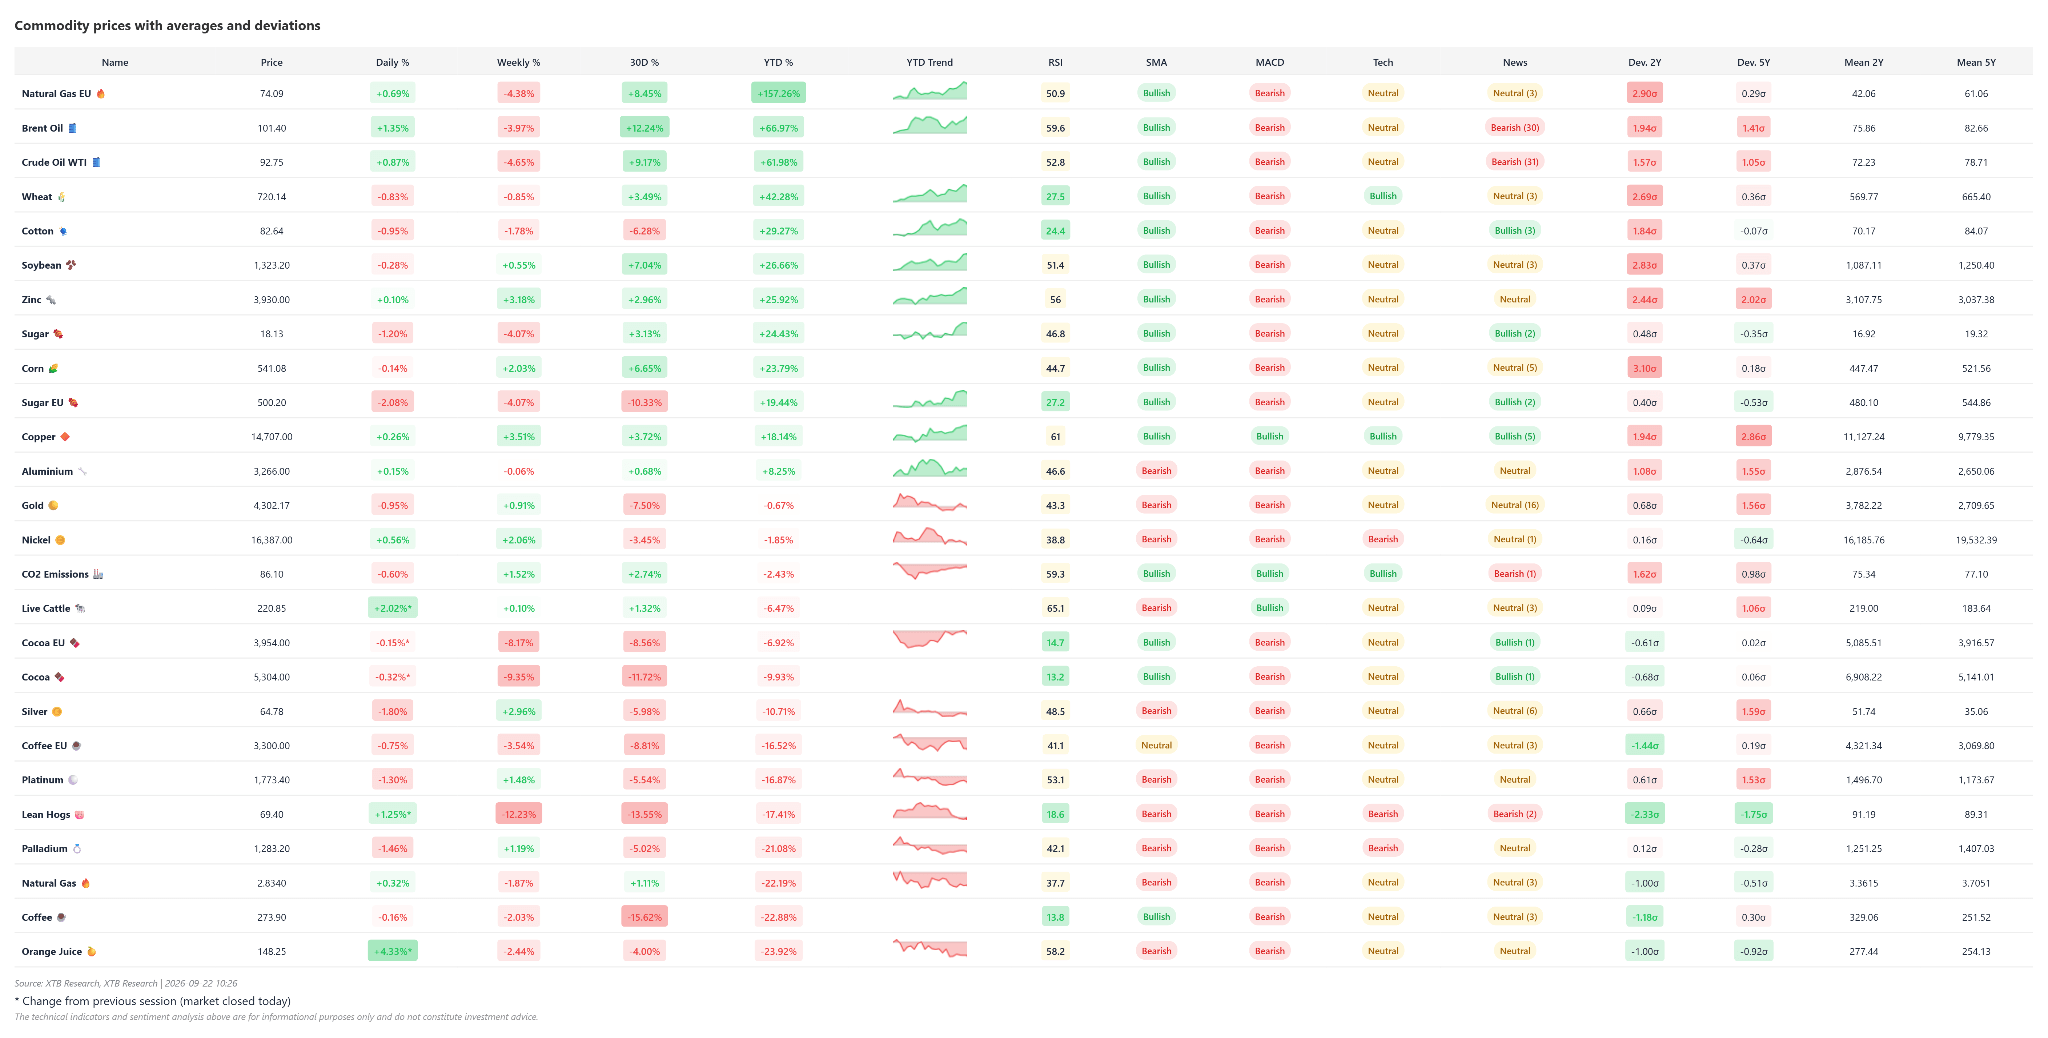
Since the beginning of this year, orange juice, coffee, and US natural gas remain sharply lower. Precious metals, except gold (which posts a minimal YTD decline), remain low. A large portion of commodities show rather negative signals from MACD. Source: XTB
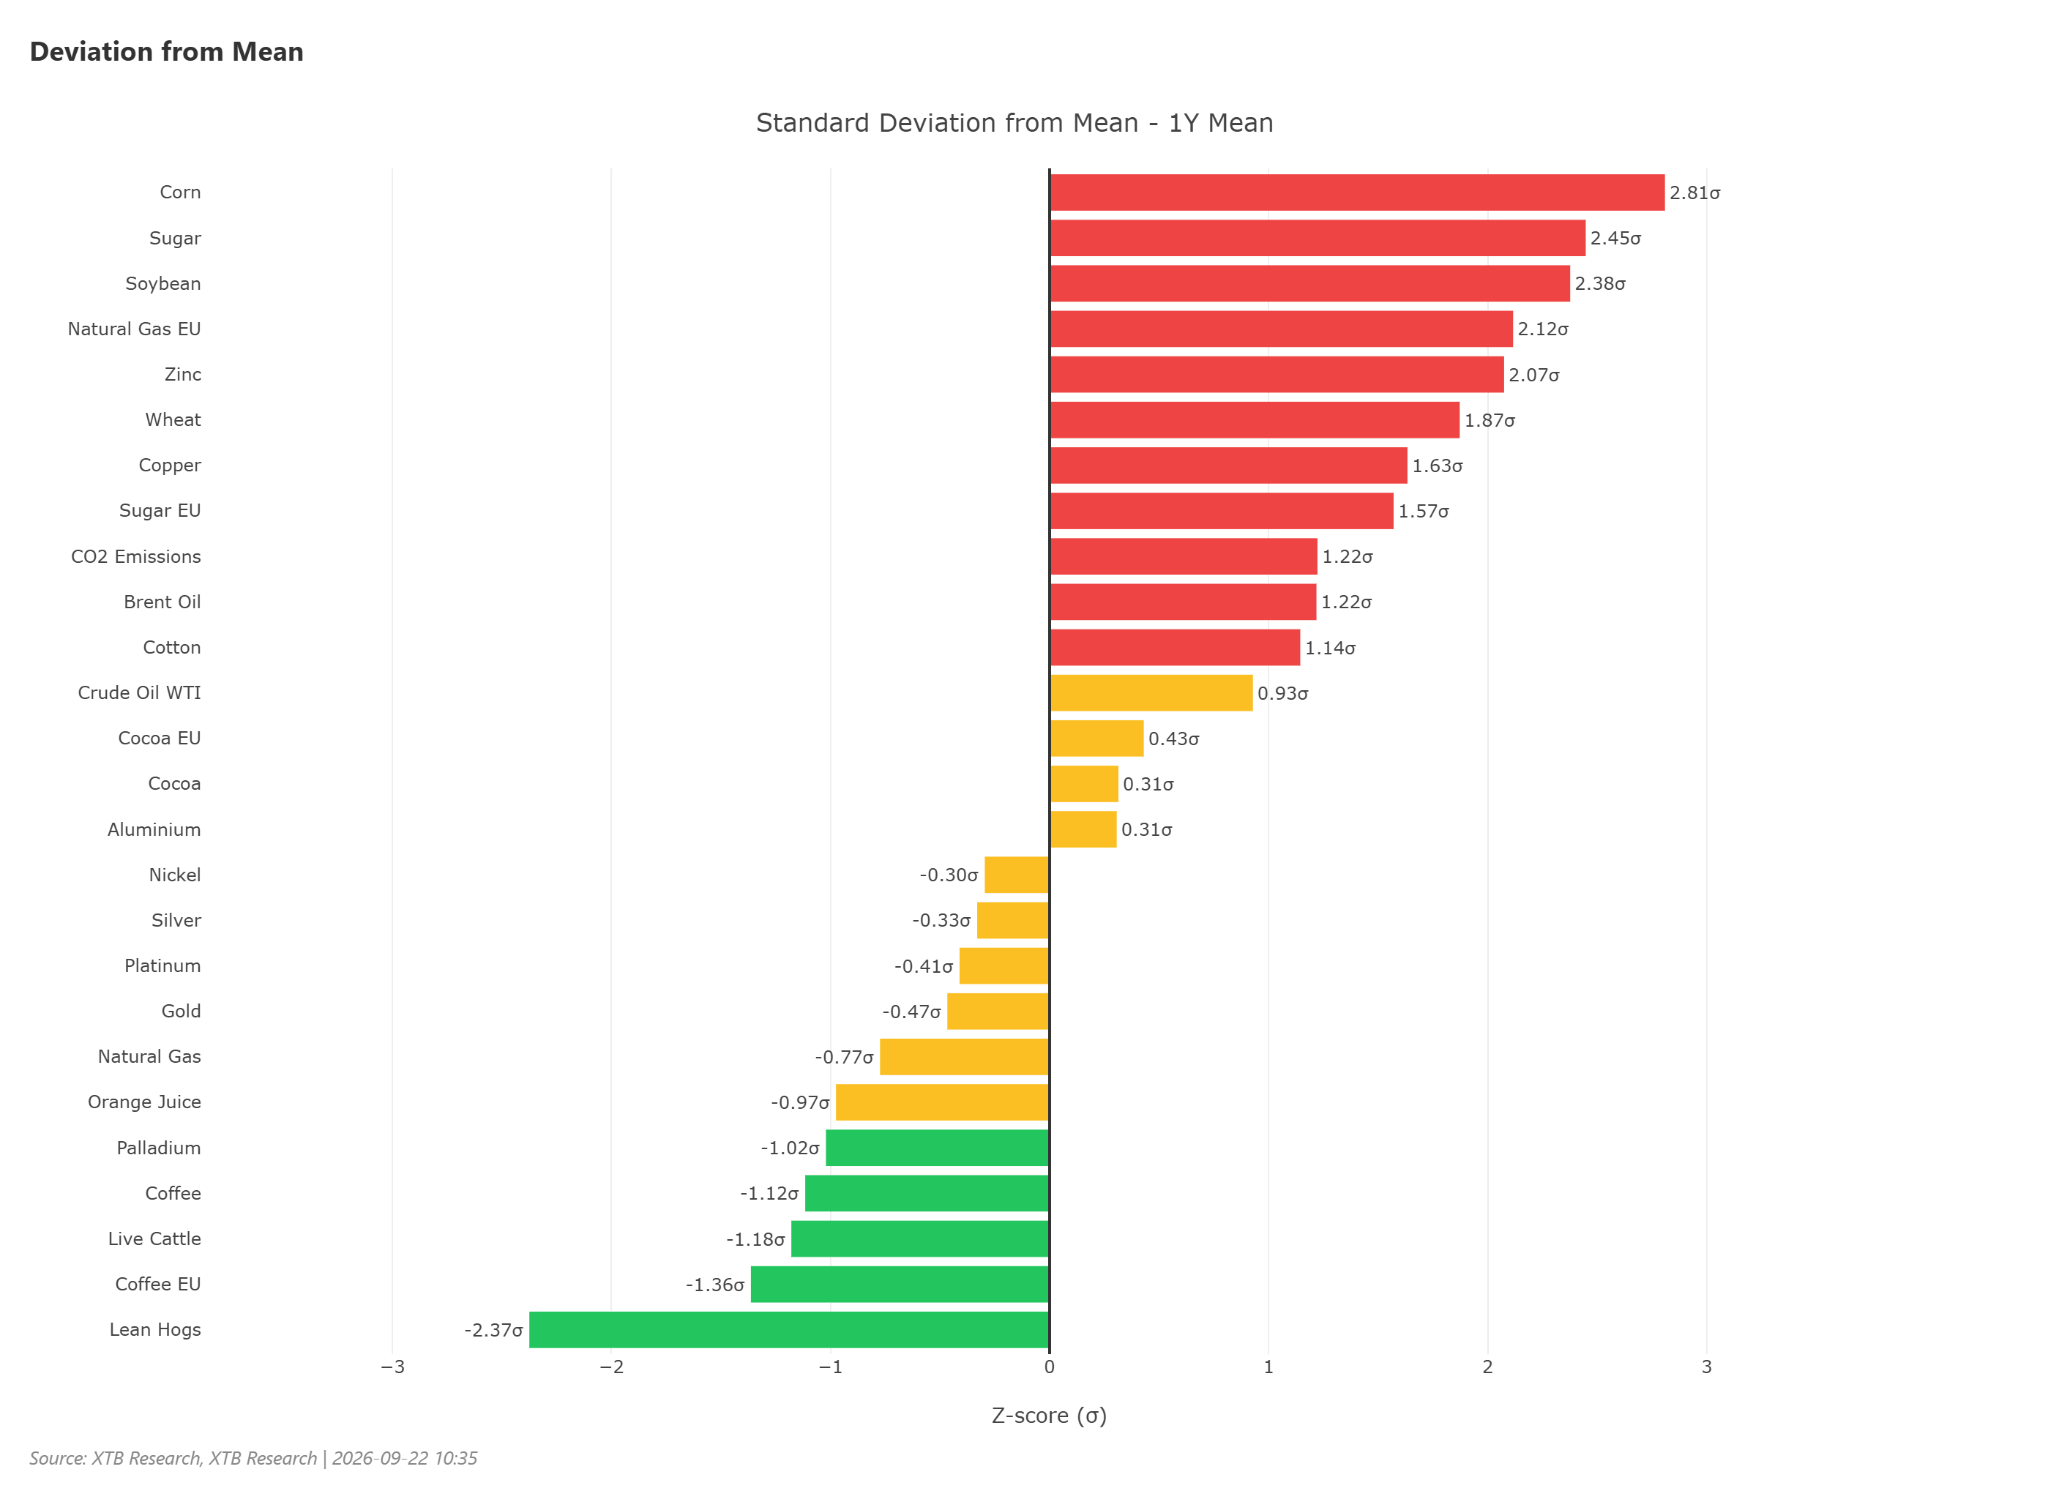
From a slightly shorter-term perspective (1 year), highly overbought markets include corn, sugar, soybeans, and European gas. At the same time, lean hogs remain heavily oversold, with coffee and cattle also somewhat oversold. Source: XTB
Natgas
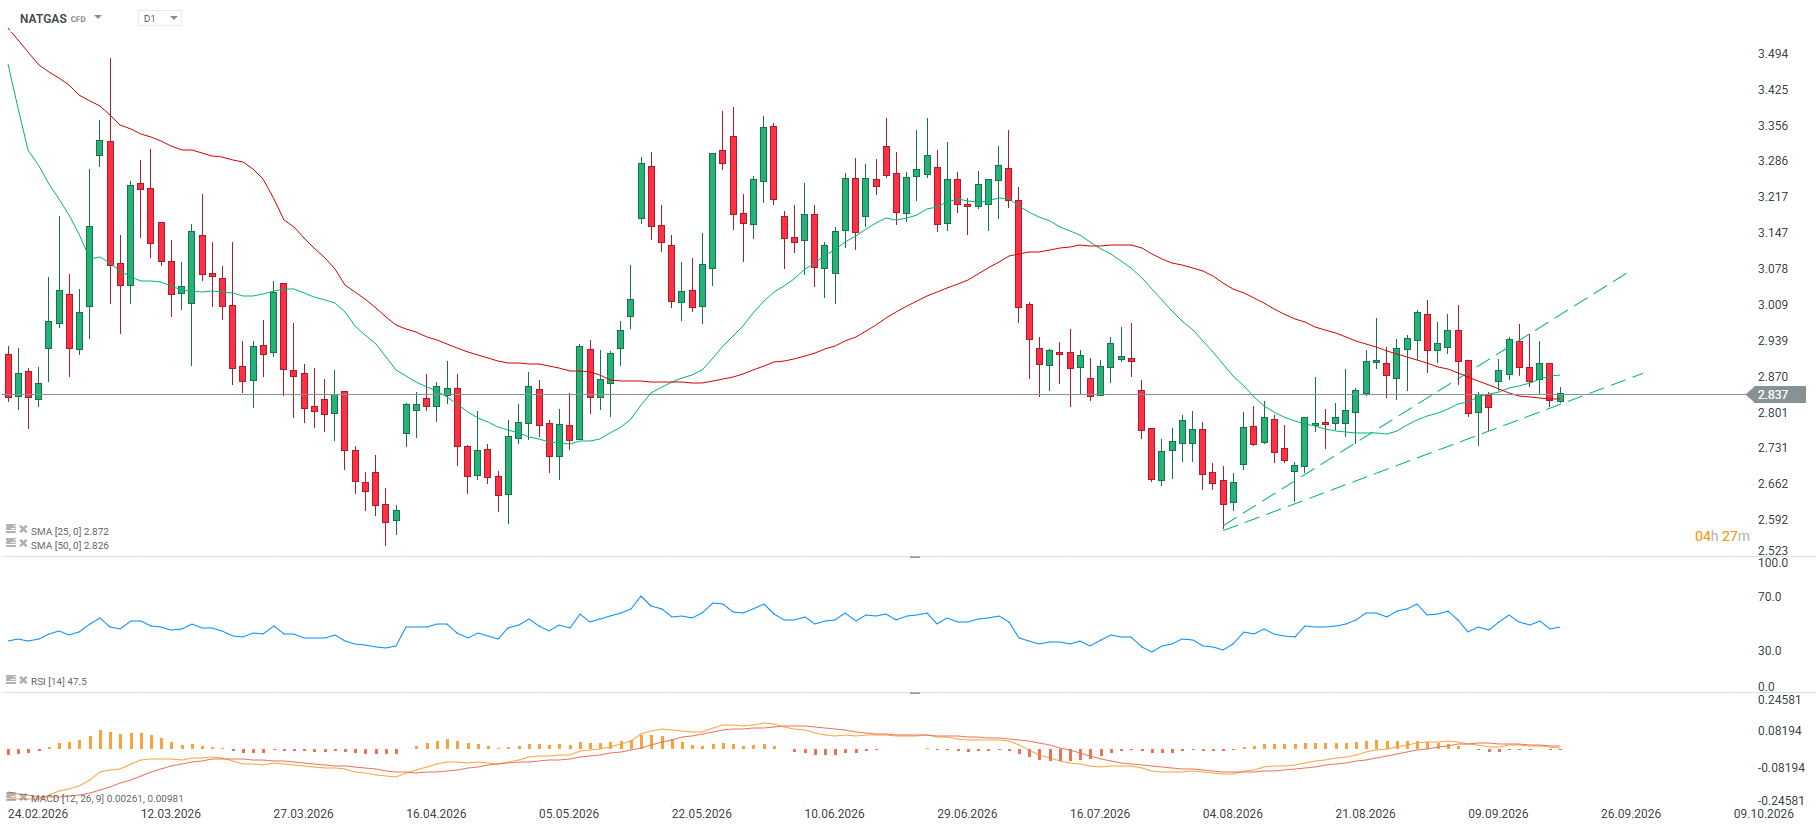
- The current price of natural gas (NATGAS) stands at 2.837, recording a weekly decline of 1.77%, while over a monthly horizon a gain of 1.21% is visible.
- On an annual basis, quotes are down 0.84%, and since the beginning of the year (YTD), the sell-off reaches 22.10%.
- The RSI indicator sits at 38, bringing the market close to the oversold zone, alongside bearish signals from simple moving averages (SMA) and the MACD indicator.
- However, the price remains minimally above the 50-period moving average (SMA50: +0.39%) with neutral market sentiment.
- After September 23, a rollover to the new futures contract will take place, which is currently trading at 3 USD/MMBTU, near recent local highs.
Fundamental and Market Context
- Energy markets are grappling with nervousness caused by geopolitical tensions in regions responsible for global security of commodity supplies.
- Natural gas prices in Europe slipped below 80 EUR/MWh amid hopes of de-escalation in the Middle East.
- European storage levels remain below their 5-year average, but significantly lower gas withdrawal is being observed, suggesting a potentially delayed start to the heating season.
- Financial institutions point to a strong short-term correlation between energy assets and global macroeconomic indicators.
- Diplomatic efforts in the Middle East exert periodic pressure on commodity assets, driving volatility in the fossil fuel segment.
- Asian buyers of energy commodities are monitoring alternative logistics routes and loading logistics in the Red Sea region.
- Gas demand outlooks in the US and Europe depend on upcoming weather forecasts for the seasonal transition period.
- North American countries are seeking new export markets in Asia amid rising trade and regulatory frictions.
- Hedge fund positioning in natural gas futures reflects a neutral stance in the absence of clear weather catalysts.
- Gas production on Monday in the US reached nearly 113 bcfd, a level 4% higher than a year ago.
- Although temperatures are higher, gas consumption reached 74.1 bcfd, up a staggering 8% year-on-year, driven by increased electricity demand.
- In the week ending September 16, US electricity generation was up 16.1% y/y, while over the last 52 weeks, electricity output was 3.3% higher y/y.
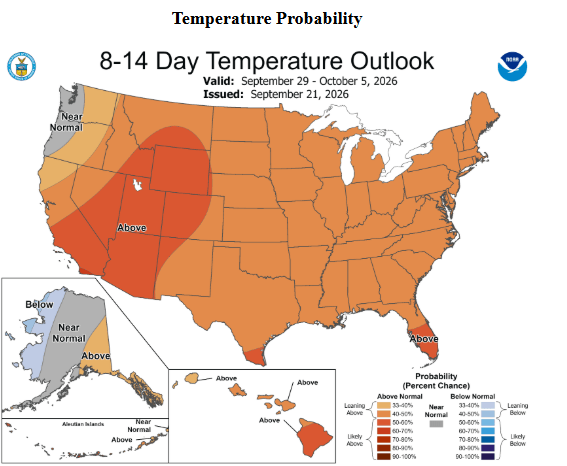
Warm temperatures in the US in the near term could delay the start of the heating season. Source: NOAA
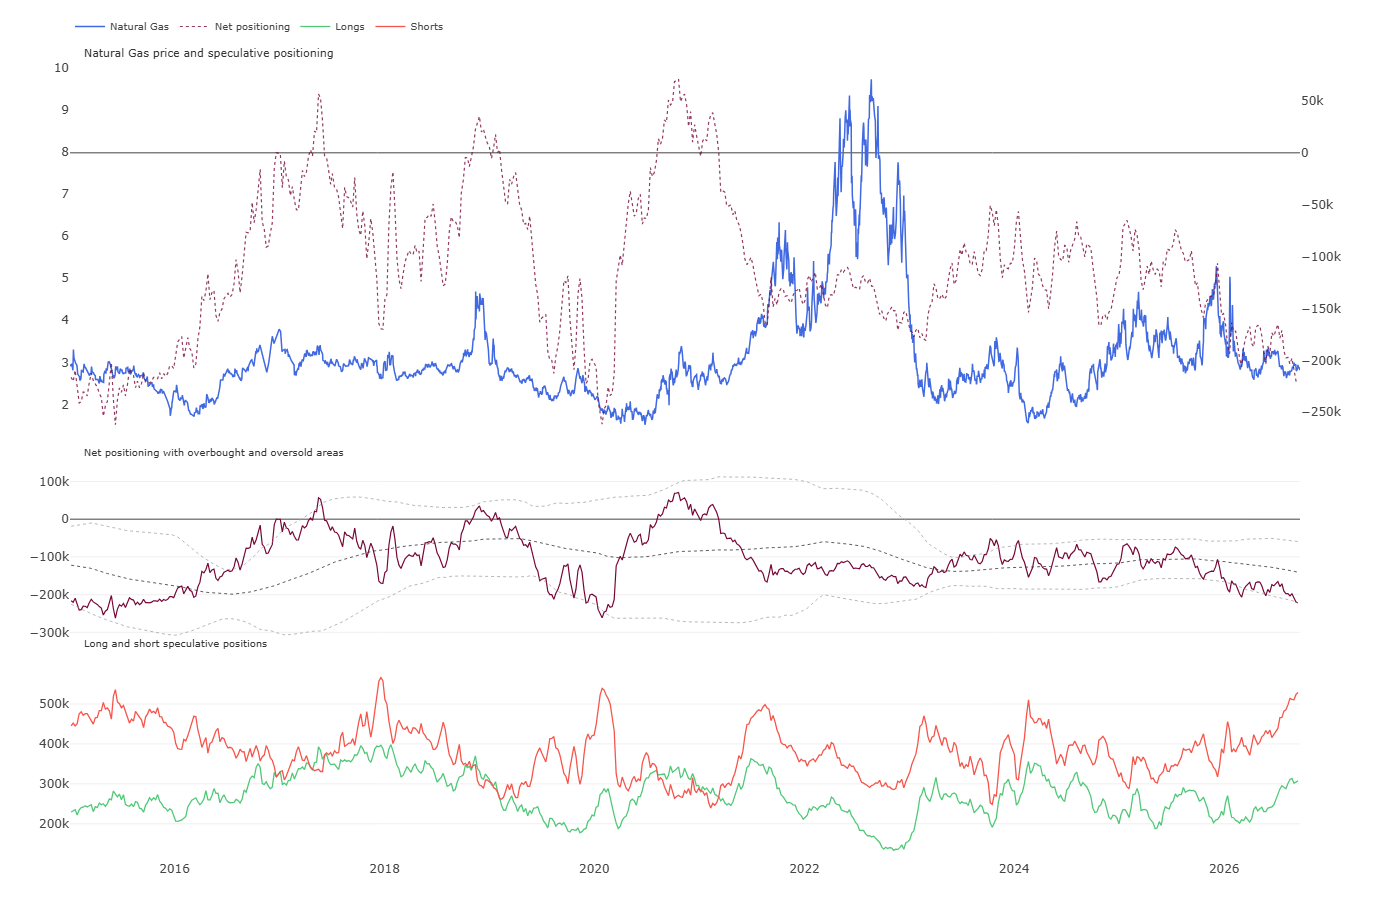
Short positions on NATGAS rose to an extremely high level of over 500,000 contracts, pushing net positions into oversold territory relative to the average. In the past, such high short positioning did not always signal a medium- or long-term trend reversal. Source: CFTC, XTB
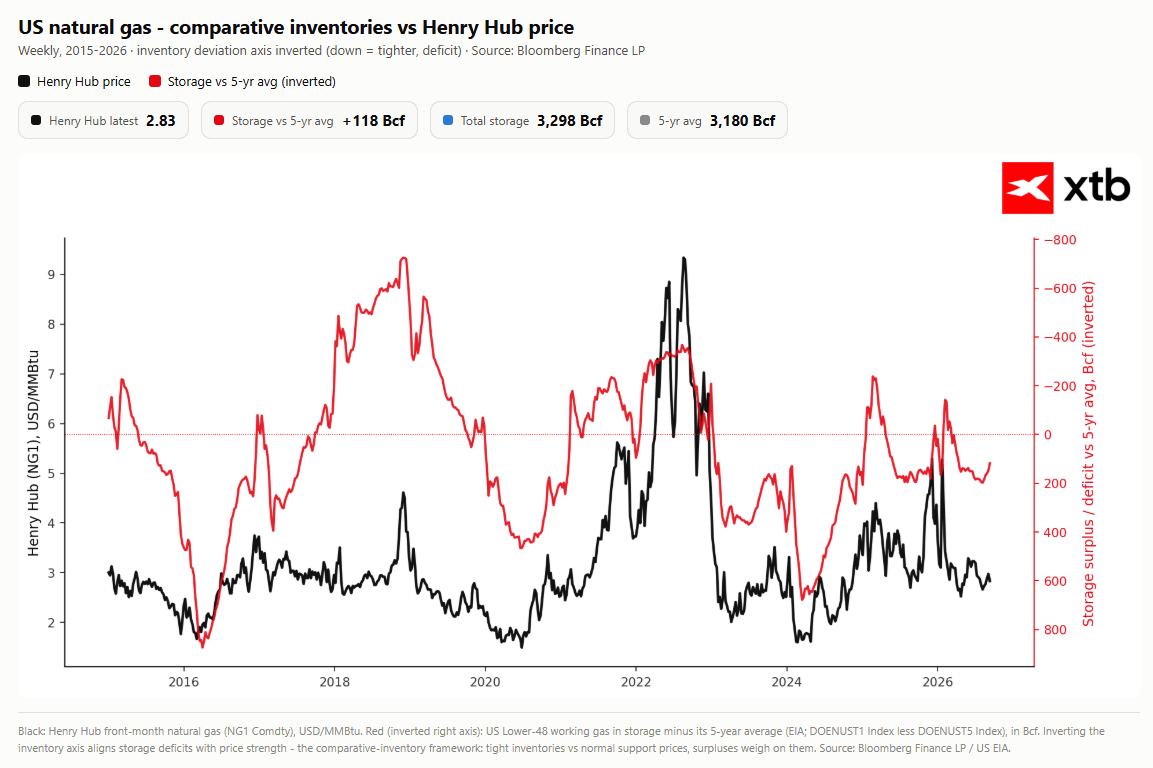
US gas inventories remain above the 5-year average, but levels are not extremely high. Source: Bloomberg Finance LP, XTB
Historical Valuation (Z-score)
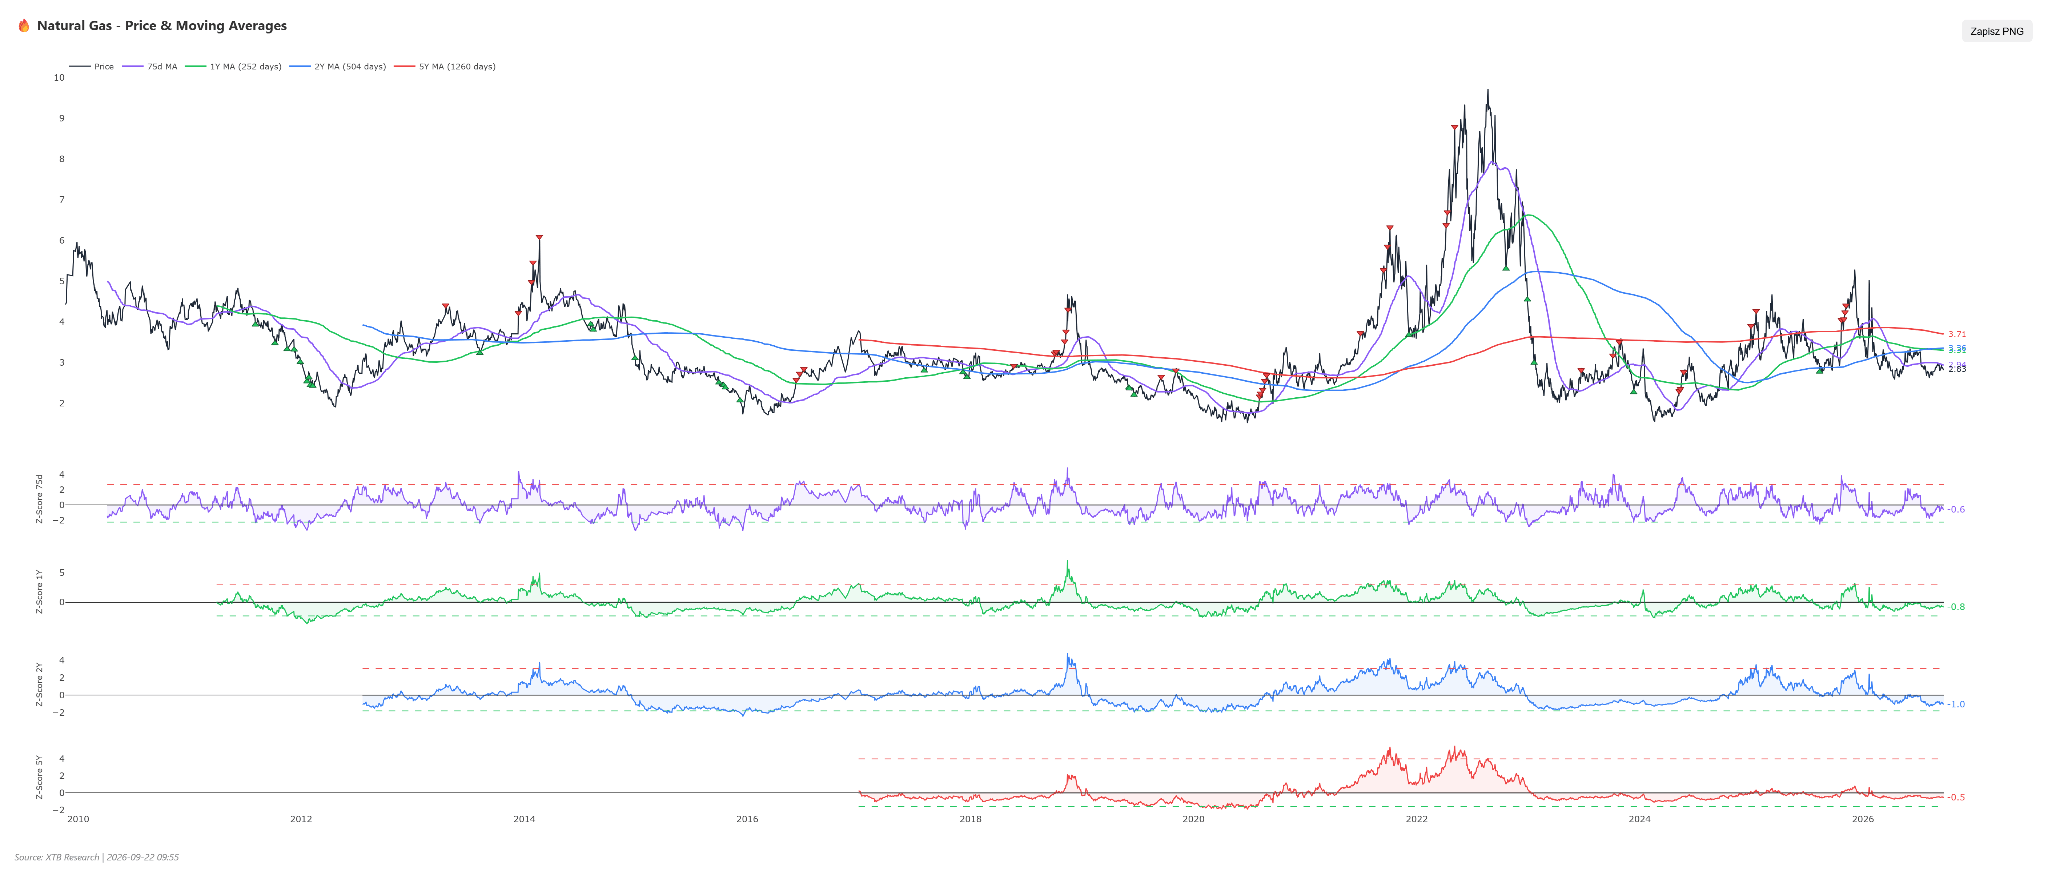
- The Z-score indicator for natural gas stands at -0.77 for the 1-year horizon (Z1Y), -0.99 for the 2-year horizon (Z2Y), and -0.50 for the 5-year horizon (Z5Y).
- Analyzing the 5-year Z-score dynamics over the past six months, this value stood at -0.46 six months ago, dipped to -0.33 three months ago, dropped sharply to -0.55 one month ago, before returning to its current level of -0.50.
- Such volatility and persistent negative values reflect a deep, structural undervaluation of the commodity relative to historical averages.
- This implies an elevated risk of sharp mean-reversion moves in the event of supply shocks or sudden temperature shifts in key consuming regions.
Scenarios
- Bullish Scenario: This scenario will materialize in the event of a sudden deterioration in weather conditions across North America and Europe, which would drastically boost heating demand, accompanied by a draw in domestic inventories reported by government agencies and escalating geopolitical tensions disrupting global energy supply routes. Technically, the market needs to break resistance around 3.00, generating buy signals on the MACD and SMA indicators, opening the door for further gains toward a target level of 3.25.
- Bearish Scenario: The bearish scenario assumes continued mild weather conditions in the upcoming season, leading to further weakening of industrial demand and accumulation of commodity surpluses in underground storage in the US and Europe, amplified by a global drop in risk aversion in commodity markets. A necessary condition is a sustained breakdown below support at 2.75 and the RSI indicator staying below 40, bringing natural gas quotes down toward a target region of 2.50.
Oil
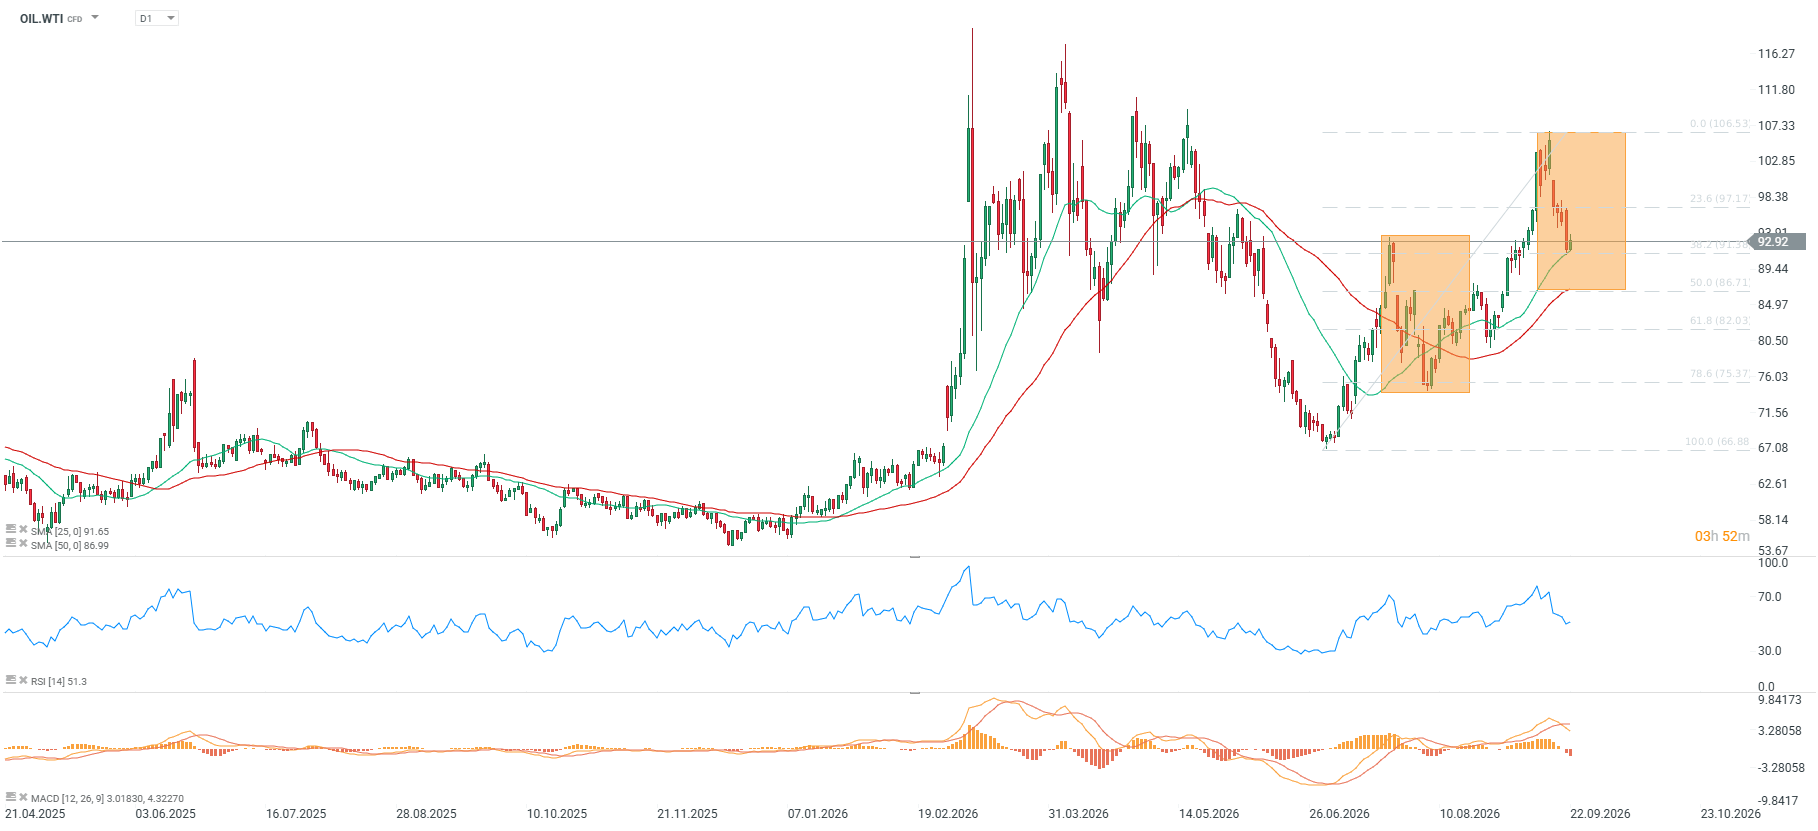
- WTI crude is trading at 92.9 USD, recording a weekly decline of 4.13%, while rising 9.76% over a monthly horizon.
- Year-to-date (YTD) gains stand at an impressive +62.85%, and on an annual scale, the commodity has gained 46.50%.
- The RSI indicator sits at a neutral reading of 53, slightly above local trough levels from pullbacks in early and late August.
- The SMA25 and SMA50 moving averages generate a bullish signal, whereas the MACD indicator points to a dominance of bearish signals.
- Price remains 7.19% above the 50-period SMA moving average, with neutral market sentiment.
Fundamental and Market Context
- Crude oil prices are currently determining the behavior of all other financial assets over the short-term horizon.
- Brent crude recorded a momentary drop below 100 USD per barrel in response to emerging hopes for a diplomatic solution to the Middle East conflict.
- Russia’s Defense Ministry reported that Russian forces carried out a strike on an oil refinery located in Kremenchuk, Ukraine.
- US Treasury Secretary Scott Bessent threatened a complete grounding and lockout of Iranian airlines from global airports, triggering geopolitical tensions.
- US authorities are exerting unprecedented pressure on Iran, translating directly into fears over conflict escalation and security of supply.
- Pakistani Interior Minister Mohsin Naqvi met in Tehran with his Iranian counterpart Eskandar Momeni to discuss regional peace amid a stalemate in US talks.
- Saudi Arabia decided to increase crude oil exports through the Strait of Hormuz. Although officially ship counts are down sharply, Saudi Arabia was reported exporting up to 3 million barrels per day through Hormuz over the past week.
- Saudi giant Aramco unofficially informed several Asian refiners that they will soon be able to receive crude directly from the Yanbu terminal on the Red Sea.
- A sharp pullback in crude prices acted as a powerful catalyst for a broad rally in equity markets, generating an energy relief effect.
- The global energy supply chain situation remains highly sensitive to headlines from the Middle East and US administration actions toward producing nations.
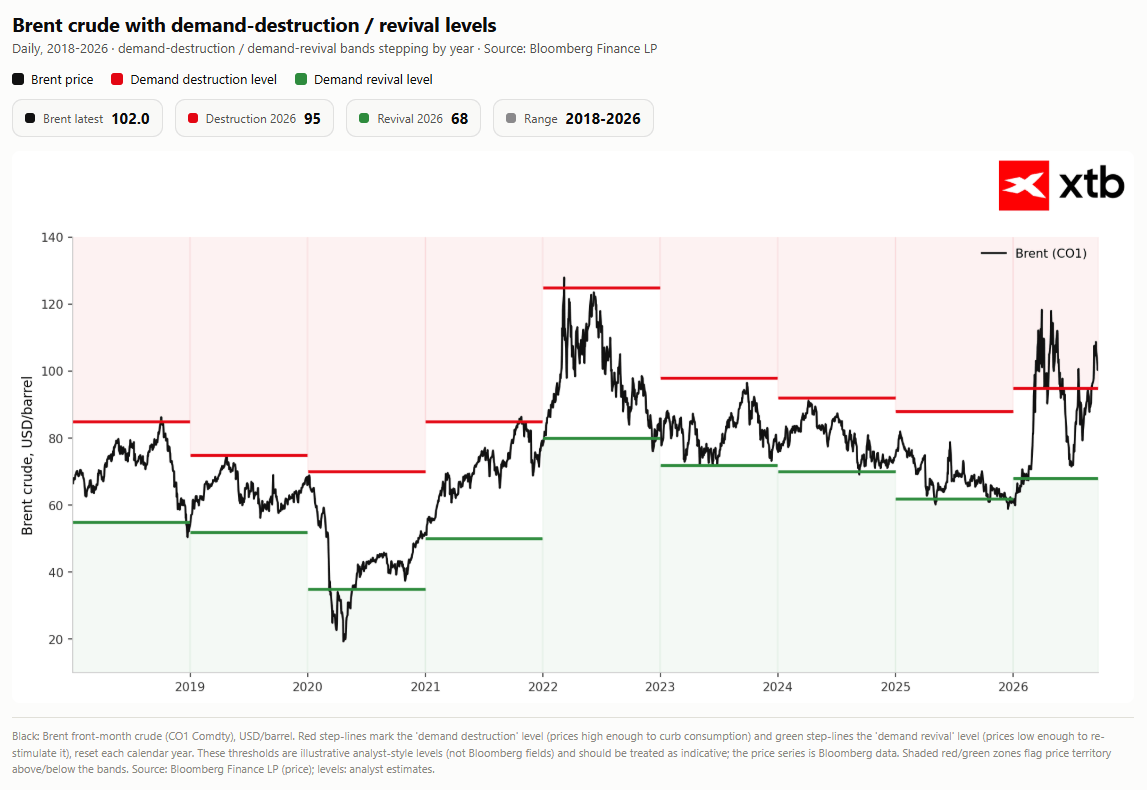
Brent crude remains in the demand destruction zone. According to industry reports, particularly in the Asian region, demand destruction can occur even at 95 USD per barrel, though previously a range of 100-120 USD per barrel was indicated. Source: Bloomberg Finance LP, XTB
Historical Valuation (Z-score)
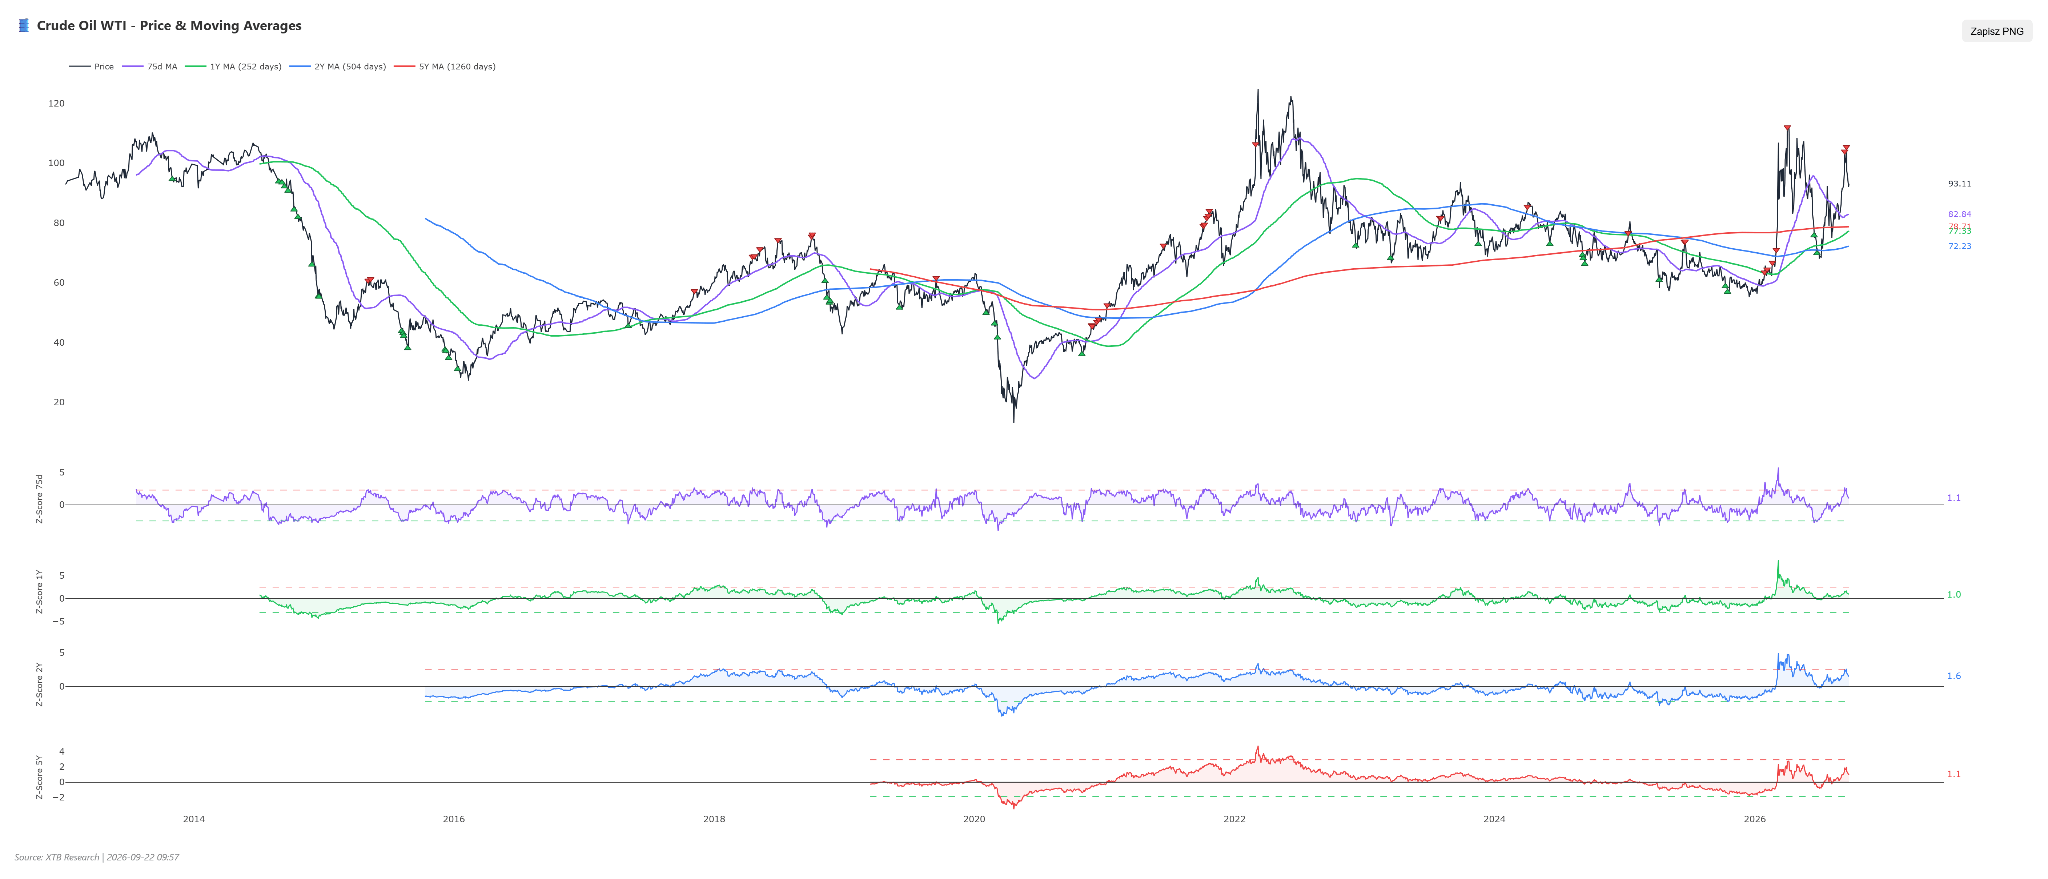
- The current Z-score indicator for crude oil stands at Z1Y +0.97, Z2Y +1.61, and Z5Y +1.09.
- Analyzing the 5-year Z-score dynamics over the past six months, it stood at +0.62 1 month ago, -0.33 3 months ago, and +1.65 6 months ago.
- On a 6-month view, the valuation first experienced a sharp dip into negative territory before rebounding significantly and stabilizing at the current elevated positive level.
- Such volatility indicates periodic deviations from historical norms, which at current positive levels signals a heightened risk of valuation correction toward multi-year averages, reflecting strong fundamental and market tensions.
- Note the generation of two recent overvaluation signals relative to the 5-year average and one signal relative to the 2-year average.
- The effectiveness of the signal based on the 3-month average is mixed. The average return remains positive for short positions over weekly, monthly, 3-month, and 1-year horizons, whereas the median return remains negative in almost every case.
Scenarios
- Bullish Scenario: The bullish scenario depends on further escalation of US-Iran tensions, implementation of drastic Washington sanctions crippling Iranian transport, and potential disruptions in key Middle East maritime bottlenecks such as the Strait of Hormuz. Technically, holding support above the 50-period SMA and decisively breaching resistance at 100 USD per barrel for Brent crude is required, which alongside strong Asian refiner demand would open the path to test 105.00 USD and further price highs.
- Bearish Scenario: The bearish scenario assumes a diplomatic breakthrough in the Middle East, permanently unwinding the geopolitical risk premium, alongside a calm-down in Red Sea and Persian Gulf export flows. Technically, a breakdown below key support levels, a fall beneath local lows, and a sustained close under the 50-period SMA are required, which as bullish signals fade would deepen the sell-off toward 88.00 USD, with potential to test support at 85.50 USD.
Cotton
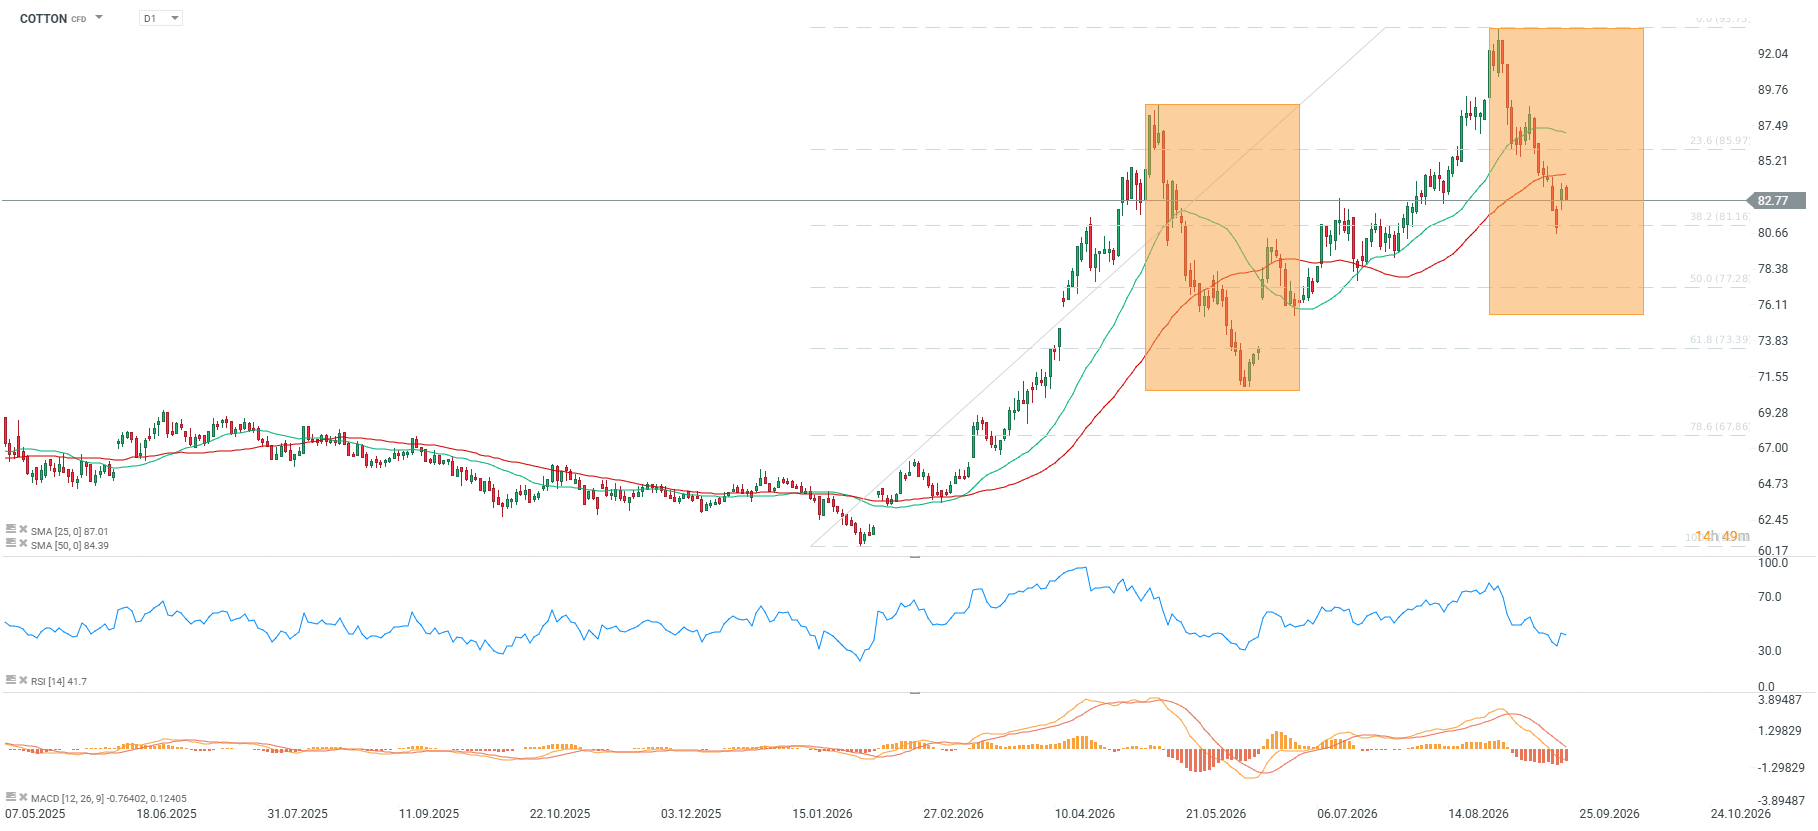
- The current price of cotton is 82.81, reflecting a 1.58% weekly drop and a 6.09% monthly decline, alongside strong year-to-date (YTD) gains of 29.53% and an annual rise of 24.45%.
- The RSI indicator sits at a very low reading of 25, indicating deep oversold conditions, while the simple moving average (SMA) generates a bullish signal and the MACD indicator remains in a bearish trend.
- Quotes are 1.88% below the 50-day moving average (SMA50), while market sentiment remains neutral.
- Price bounced off support linked to the 38.2 Fibonacci retracement of the entire upward wave, but the recent correction pattern continues to form lower lows and lower highs, suggesting it may not be complete yet.
- The scope of the previous major correction points to a possible downside extension toward the 75-cent region.
Fundamental and Market Context
- Global cotton production for the 2026-2027 season was lowered in the latest USDA report by over 300,000 bales to 117.32 million bales, compared to 117.63 million bales projected a month earlier.
- The reduction in global harvest stems directly from smaller crops in the United States, Turkey, and Pakistan, partially offset by higher production forecasts for Brazil, the African Franc Zone (CFA), and Kazakhstan.
- Global cotton supplies for 2026-2027 were nudged higher to 192.62 million bales from 192.44 million bales recorded the previous month, owing to higher beginning stocks of 75.31 million bales.
- Global cotton consumption remains unchanged at 122.92 million bales, reflecting stable demand from major processing hubs.
- International cotton trade shows an upward trend, with global trade volume increased by around 400,000 bales to 44.22 million bales, driven by stronger exports from Brazil and the African Franc Zone.
- Import demand centers around Turkey, Indonesia, and Pakistan, where domestic requirement exceeds local production capacity.
- Brazil’s export forecast was raised by 200,000 bales to 15.50 million bales, while estimates for its domestic production rose 250,000 bales to 18.50 million bales.
- Global ending stocks for the 2026-2027 season increased by about 170,000 bales to 69.86 million bales, leading to a slight tick up in the global stocks-to-use ratio to around 56.8 percent.
- China’s production forecast for 2026-2027 remained unchanged at 33.50 million bales, with imports at 7 million bales and consumption around 42 million bales.
- The situation in India also remains stable, with production at 24 million bales, consumption at 26.50 million bales, and imports held at 3 million bales, while domestic ending stocks rose to 10.32 million bales.
- In Turkey, production forecasts were slashed by 300,000 bales to 2.40 million bales, forcing a 200,000-bale increase in import estimates to 5 million bales.
- Pakistan recorded a crop reduction of 100,000 bales to 5 million bales, pulling up imports by a corresponding amount to 5.10 million bales.
- The US cotton market is characterized by significant fundamental tightening, with the USDA cutting 2026-2027 US production by roughly 410,000 bales to 13.20 million bales, down nearly 3 percent.
- National average yields in the US were lowered by 22 pounds to 776 pounds per harvested acre, and harvested area decreased marginally to 8.16 million acres on planted area estimated at 10.45 million acres.
- Domestic mill use by US spinners dropped 100,000 bales to 1.50 million bales amid the ongoing contraction of the domestic textile manufacturing base, while exports were left unchanged at 12.30 million bales.
- US ending stocks for 2026-2027 were reduced by 10 percent to 3.60 million bales, severely limiting external supply from the US and supporting prices at origin.
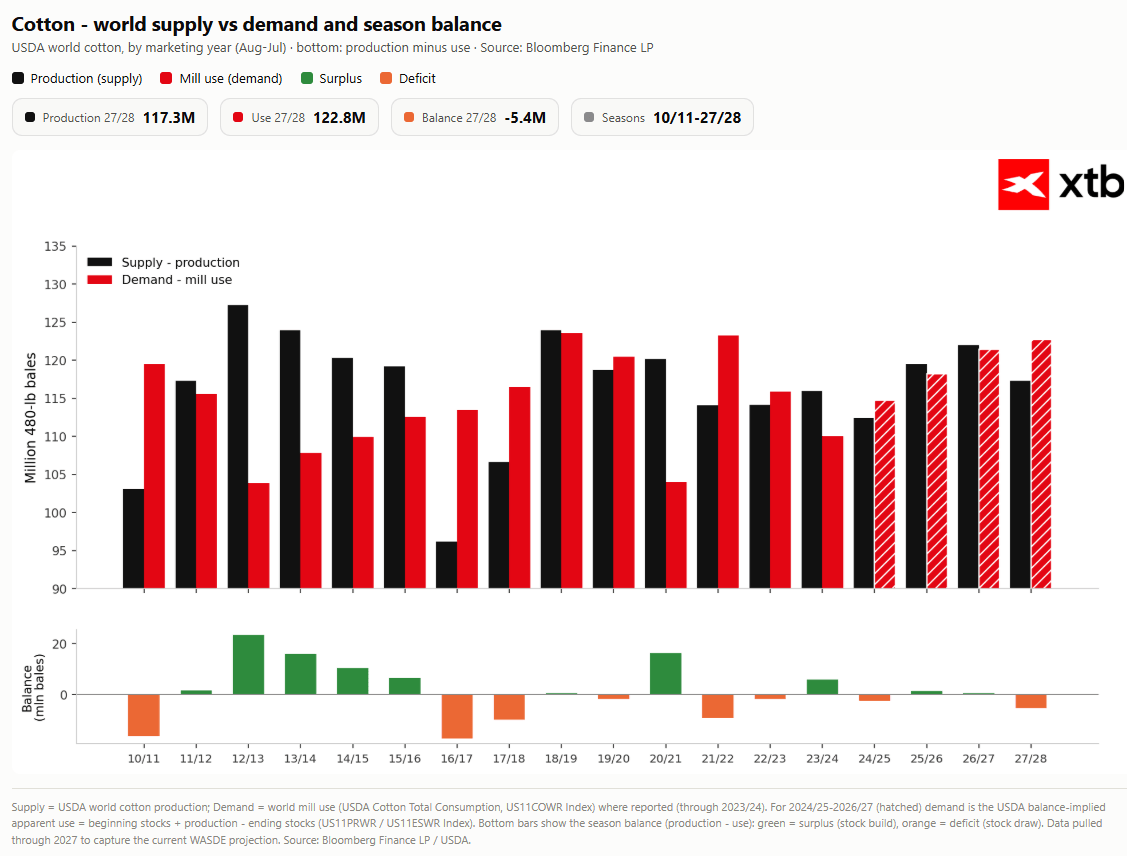
Cotton market demand in the current season is expected to be significantly larger than production, which is falling after 2 years of recovery. Source: Bloomberg Finance LP, XTB
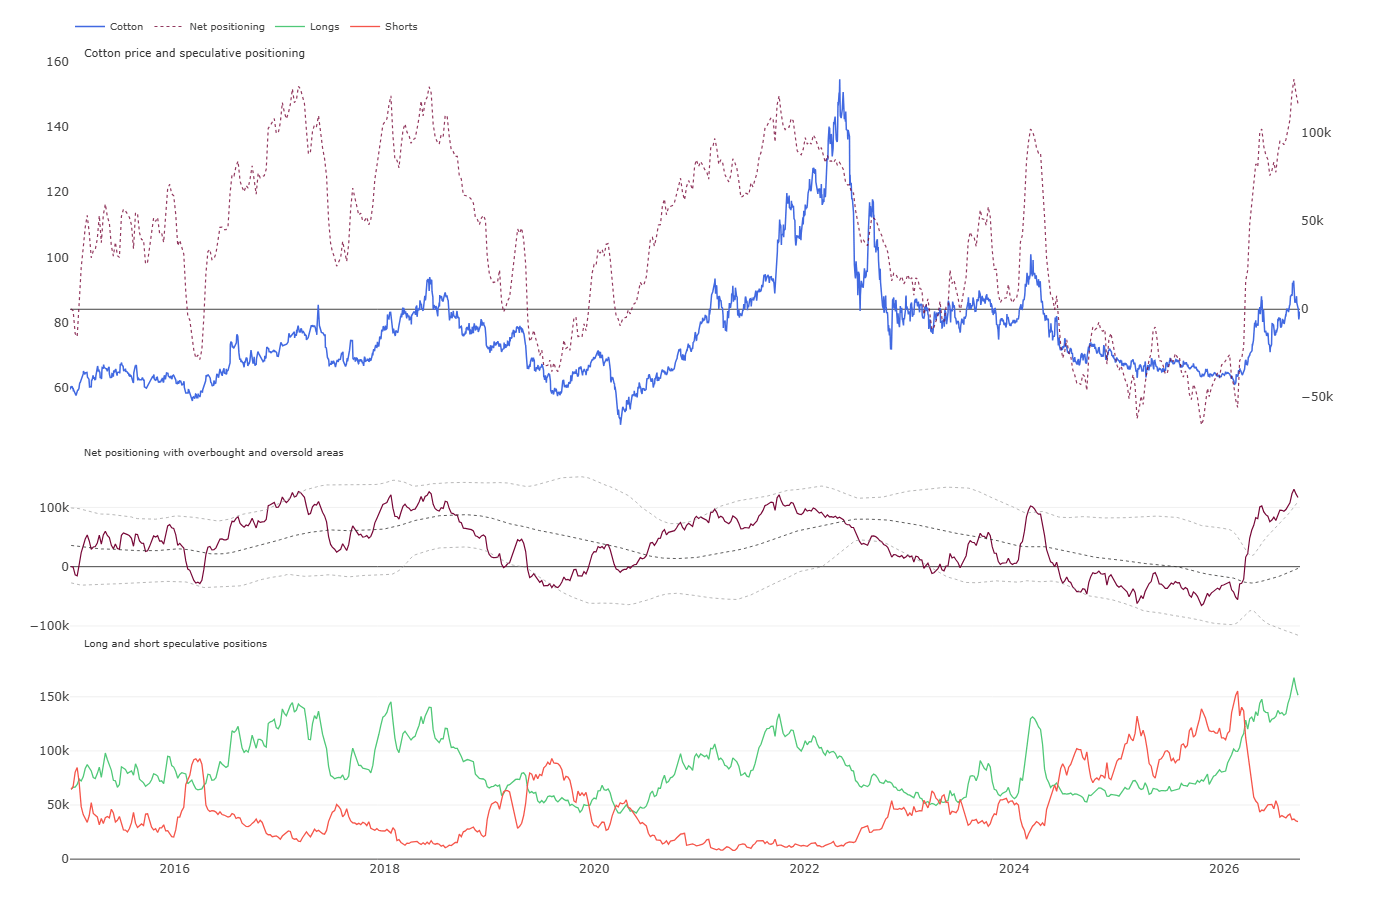
Net positioning on cotton remained at an extremely high level. Both long and short positions are at extreme readings. Although fundamentals are shifting in favor of the bulls, a potential pullback in oil could lead to a significant liquidation of long positions, as seen in 2024. On the other hand, the current long position was built up over an extended period, and the move in net positioning to high levels was the result of short covering. Therefore, only a rebound in short positions could trigger a larger and deeper correction, similar to 2024. Source: CFTC, XTB
Historical Valuation (Z-score)
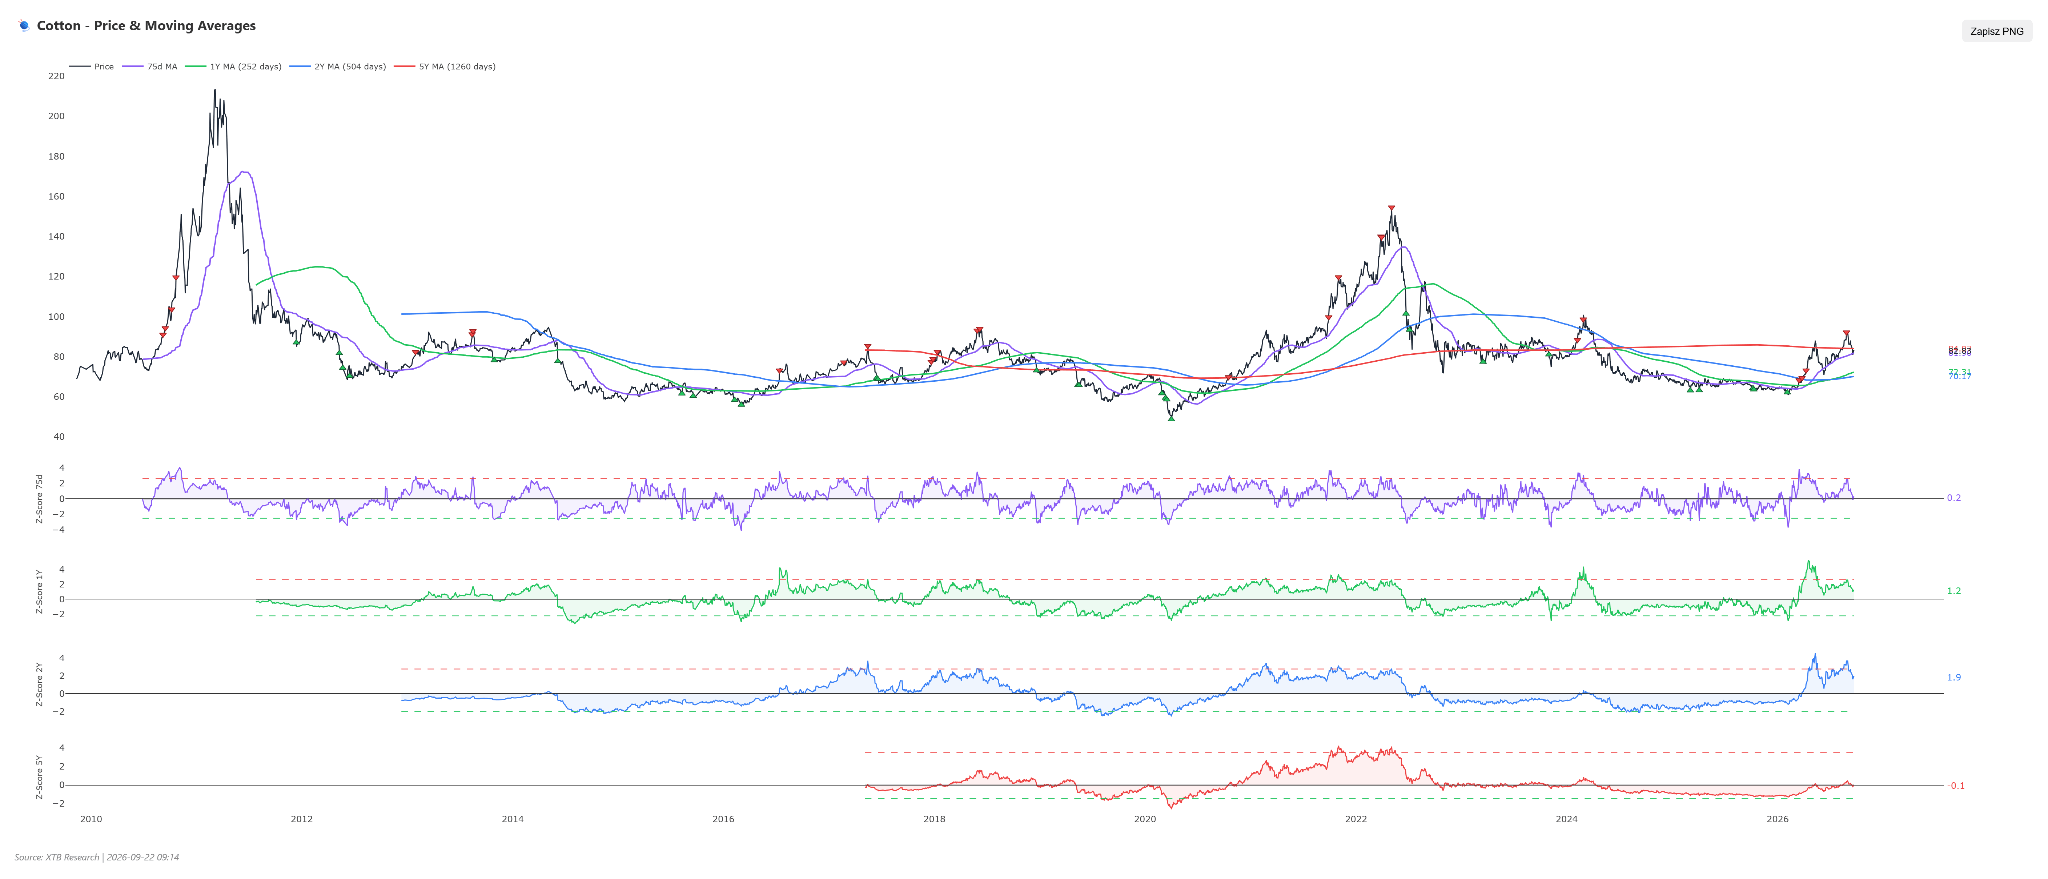
- The 1-year Z-score for cotton currently stands at 1.19, the 2-year Z-score sits at 1.86, while the 5-year Z-score reaches -0.07.
- Analyzing 5-year Z-score dynamics over the last six months shows clear structural volatility: six months ago the indicator stood at -0.99, three months ago it dropped to -0.24, one month ago it rose to 0.21, and currently it has eased back slightly to stabilize around -0.07.
- This path points to a strong temporary surge in valuation last month, followed by market stabilization around multi-year medium-term equilibrium.
- The current near-zero reading suggests cotton valuation has reverted to its historical norm, dampening extreme price deviation risks, although solid supply fundamentals could soon push prices to retest higher valuation bands.
Scenarios
- Bullish Scenario: This scenario assumes a reversal of the current downtrend supported by strong supply-side fundamentals stemming from lower global harvests and deep market oversold conditions confirmed by an RSI reading of 25. A prerequisite for this scenario is holding technical support around 82.00, a price bounce above the 50-day moving average, and fresh buying interest from Asian processors offsetting shrinking US inventories. Breaking resistance at 85.50 opens the way to a rapid move toward the 88.00 – 90.00 zone.
- Bearish Scenario: This scenario assumes continued bearish pressure stemming from a persistent negative MACD signal and declining US domestic textile activity. A necessary condition to enter this phase is a decisive breakdown below key technical support at 82.00, negating support signals and triggering long liquidation by financial investors. A deepening sell-off in this scenario would send cotton prices down toward the psychological 78.00 – 76.50 region.
Cocoa
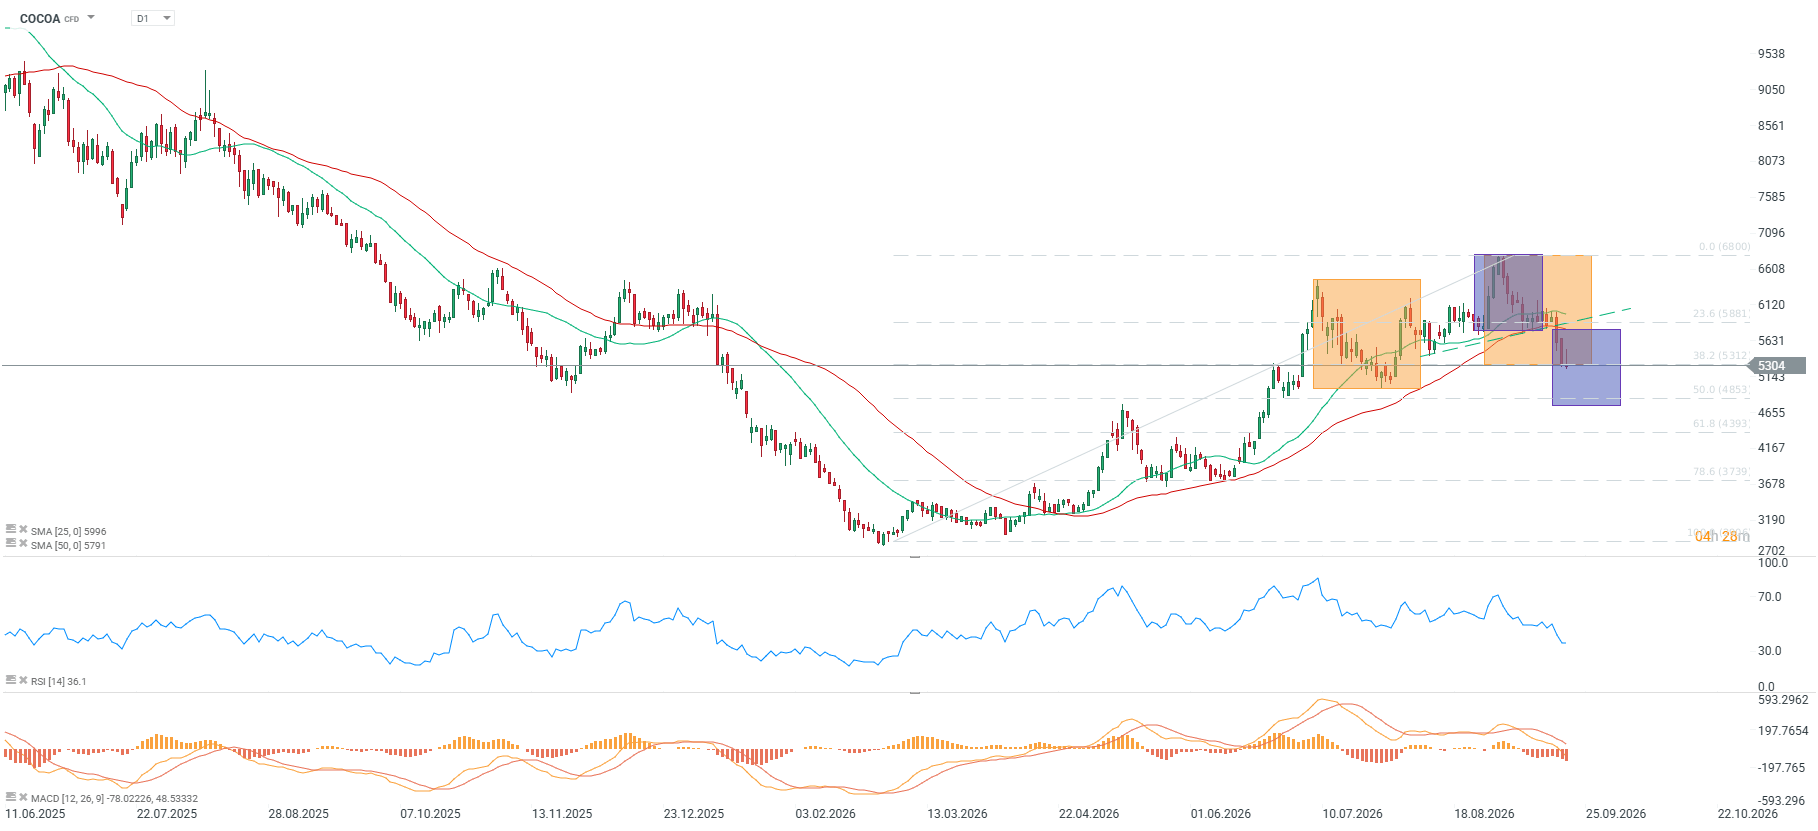
- Cocoa quotes are oscillating around 5304.0 points, recording a weekly drop of 9.35%, a monthly decline of 11.72%, and a deep annual correction of 24.21%, while year-to-date (YTD) performance stands at -9.93%.
- The RSI indicator sits at an extremely oversold level of 13, drastically increasing the likelihood of a strong technical rebound, even as the simple moving average (SMA) generates a bullish signal and the MACD indicator stays in a bearish trend. The current price is 8.41% below the 50-period moving average (SMA50), with neutral market sentiment.
- The price is breaking below an ascending trendline that served as the neckline of a local Head and Shoulders pattern targeting near 4800 USD per ton.
- Support at the 50.0 Fibonacci retracement remains key, coinciding with April highs and a local trough from November 2025.
Fundamental and Market Context
- The current situation in the cocoa market remains under heavy supply pressure, reflected by double-digit price drops on a monthly basis.
- Market participant sentiment is characterized as neutral, even though technical indicators signal deep oversold conditions.
- Global supply and demand dynamics undergo continuous shifts influenced by agrometeorological conditions in key growing regions.
- The term structure of the cocoa forward curve points to mixed investor expectations over short- versus long-term horizons.
- Trading liquidity on futures exchanges remains stable, although hedge funds are adjusting exposure to prevailing macroeconomic conditions.
- Margin pressures on chocolate manufacturers constrain aggressive spot purchasing activity on physical markets.
- Seasonal harvest patterns in West Africa are being scrutinized by analysts for potential output volume revisions.
- Expectations around future supply balances shape long-term futures valuations for the commodity.
- Speculative activity in futures contracts amplifies short-term price swings, pushing quotes toward key support levels.
- The regulator in Ivory Coast reported that 2.06 million tons of beans were harvested from June 2025 to June 2026, compared to 1.58 million tons a year earlier.
- The decision to move the start of the marketing year to September 1 to sell larger amounts of cocoa indicates that oversupply, rather than potential production issues, remains the key market concern.
- Bloomberg continues to analyze the season starting October 1; however, based on Ivory Coast data, port arrivals during September 1–13, 2026 compared to October 1–12, 2025 showed almost 46% lower deliveries.
- On the other hand, Monday’s price rebound was linked to drought concerns, which could lead to harvesting issues as the main crop officially kicks off in early October.
- Exchange inventories continue to rise, reaching 3.4 million bags, the highest level in 2 years.
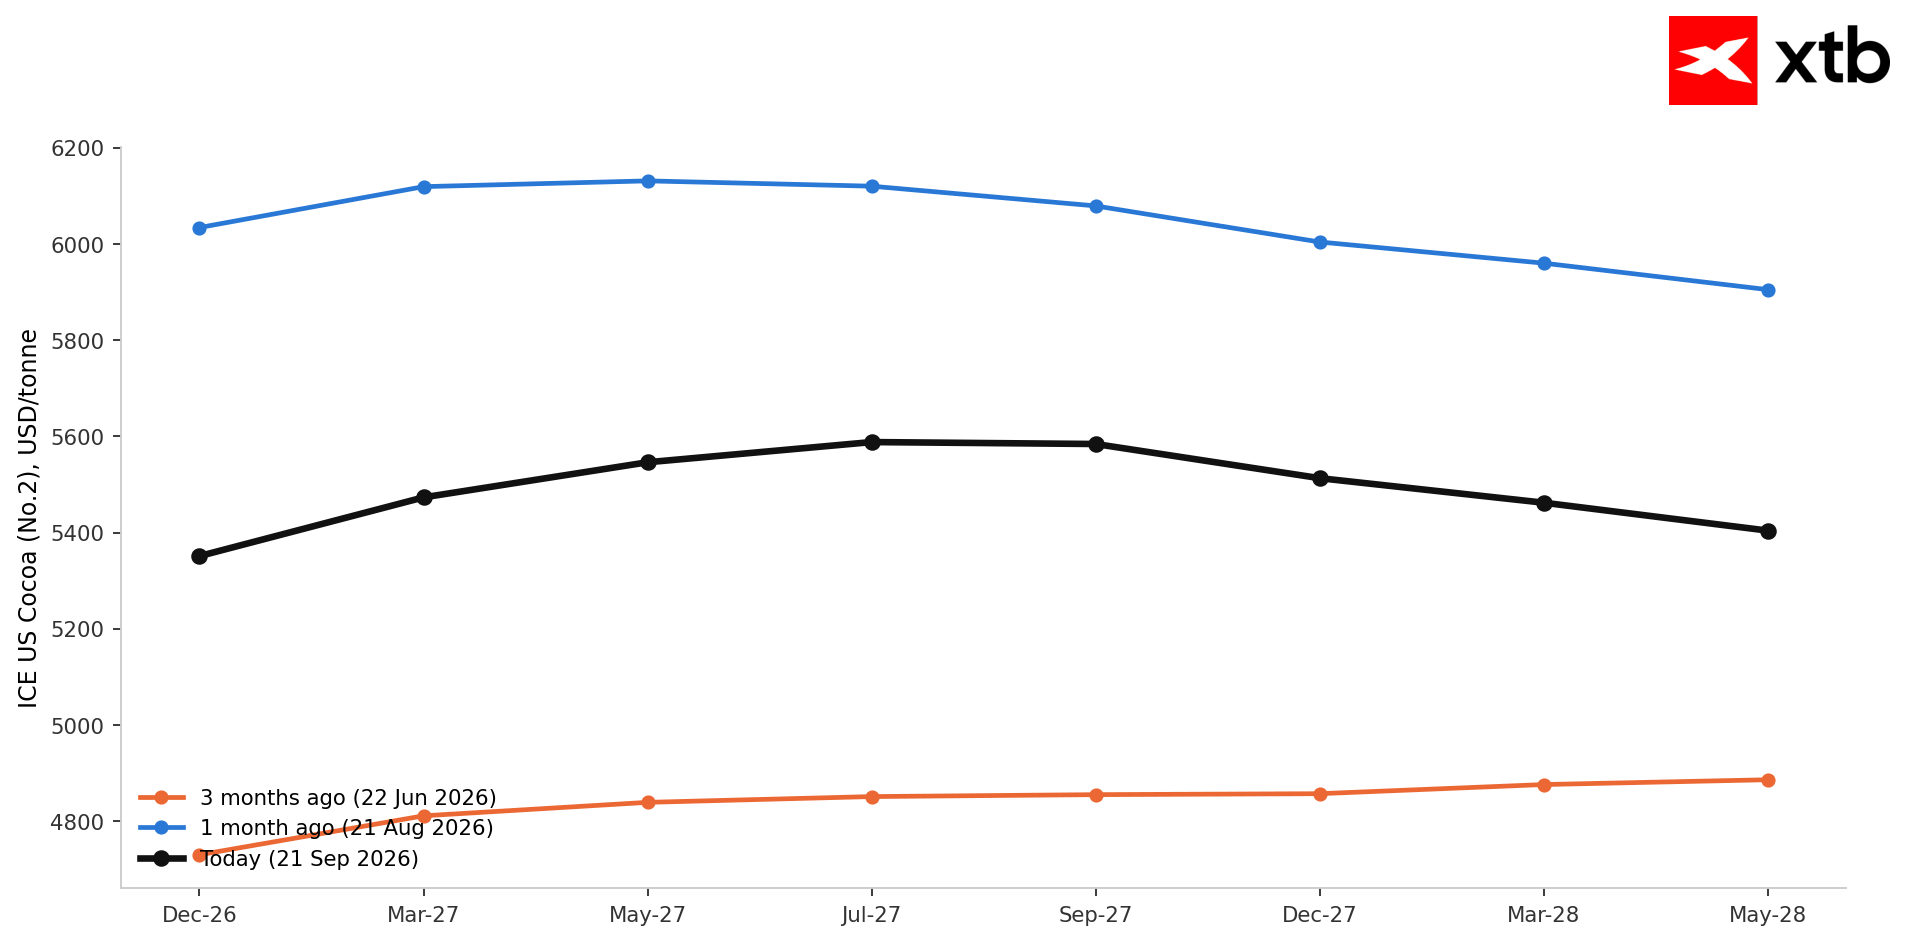
Cocoa is entering a slightly deeper contango on the short end of the curve than a month ago. Source: Bloomberg Finance LP, XTB
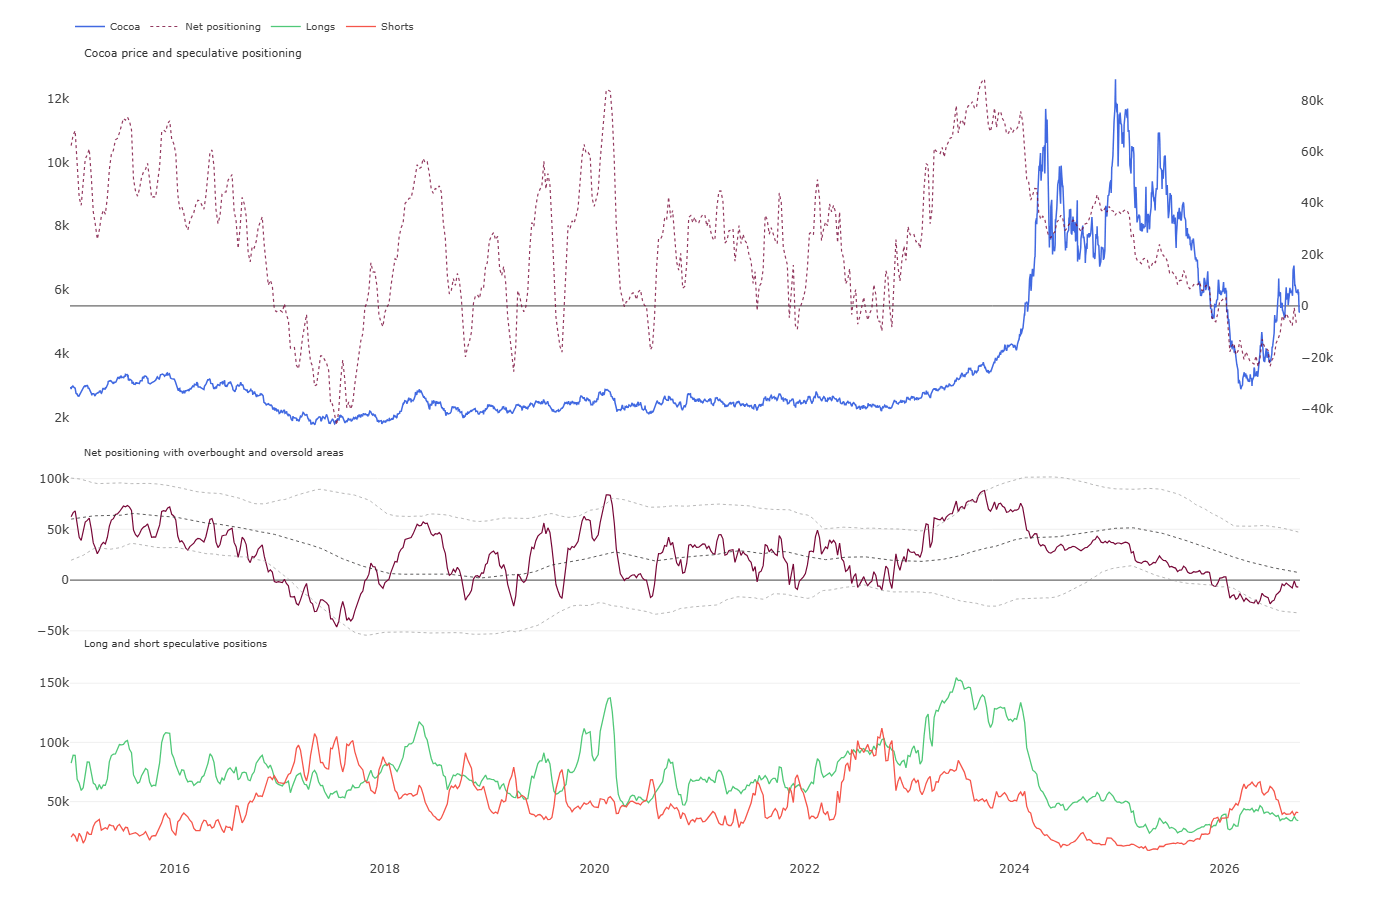
We can see that there is no pressure from buyers in the market, while the selling side remains stable for now. Source: CFTC, XTB
Historical Valuation (Z-score)
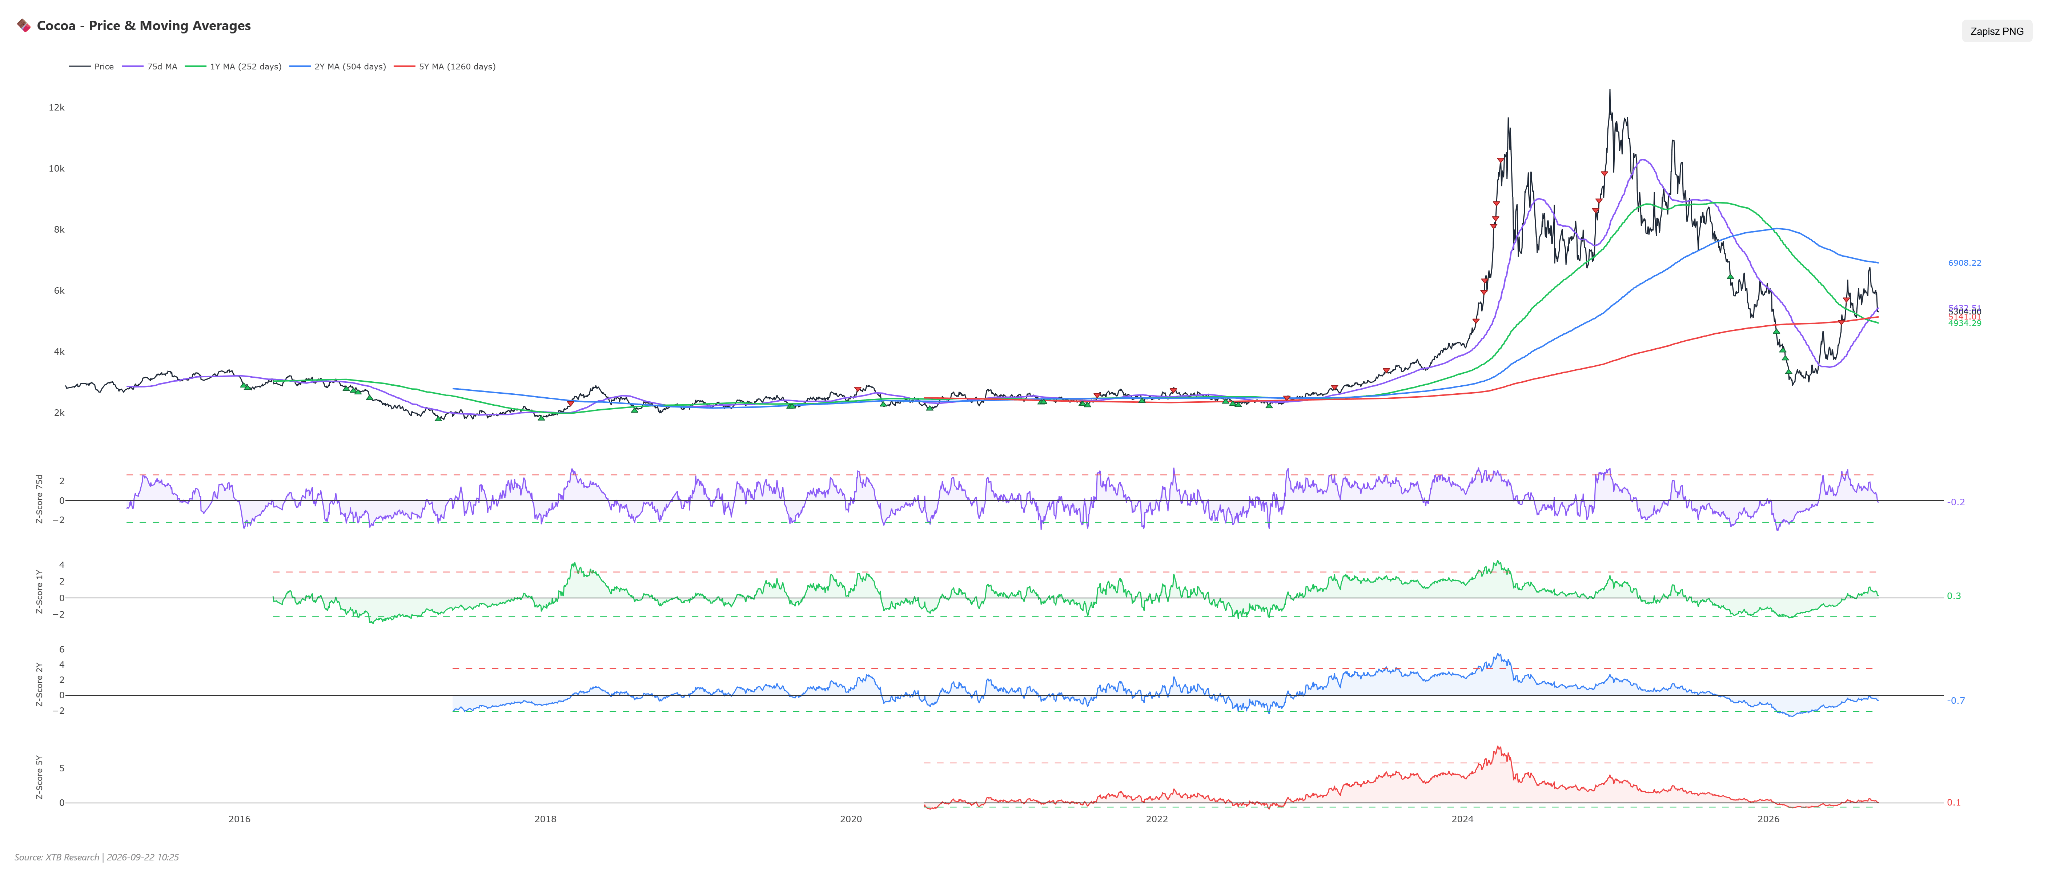
- The 1-year Z-score reading for cocoa stands at Z1Y +0.31, the 2-year Z2Y at -0.68, while the 5-year Z-score (Z5Y) settles at +0.06.
- Analyzing 5-year Z-score dynamics over the last six months, six months ago it stood at -0.56, three months ago it dropped to -0.27, one month ago it bounced to +0.31, and currently it has stabilized at +0.06.
- This path points to a temporary cooling of excessive valuations and a return toward the historical mean, lowering structural overvaluation risks and suggesting the market is seeking new fundamental equilibrium after earlier extreme swings.
Scenarios
- Bullish Scenario: A necessary condition for the bullish scenario to materialize is holding strong technical support stemming from an extremely low RSI level and diminishing sell pressure from short funds. For an upward move to gain momentum, cocoa prices must firmly return above the 50-period moving average SMA50, aided by a revival in physical demand from processors and positive supply-demand balance revisions in upcoming industry reports. Fulfilling these conditions will open the path to a dynamic move back toward resistance at 5850.0 USD, and over a longer horizon a test of the 6200.0 USD area.
- Bearish Scenario: The bearish scenario will materialize if current negative MACD signals dominate the market and bears take full control following a breach of key technical barriers. A condition for a deeper sell-off is keeping prices below the 50-period moving average with a lack of buying response at current oversold RSI levels, which could be encouraged by weaker macroeconomic data indicating constrained consumer demand for chocolate products. In such an environment, cocoa quotes could extend losses toward the support zone at 4950.0 USD, with potential to test deeper lows around 4600.0 USD.