S&P 500 — US Large Cap Index
 FTSE 100 — UK Blue Chips
 Euro Stoxx 50 — Eurozone Leaders
 DAX 40 — German Equities
 CAC 40 — French Market Index
 Nikkei 225 — Japan Benchmark
 Hang Seng — Hong Kong Index
 Shanghai Composite — China Mainland
 ASX 200 — Australian Market
 TSX Composite — Canada Index
 Nifty 50 — India Large Cap
 STI Index — Singapore Market
 KOSPI — South Korea Index
 Bovespa — Brazil Equities
 JSE Top 40 — South Africa Index
 IPC Index — Mexico Market
GBP/USD Price Forecast: Treading water around 1.3400 with central banks in focus


- GBP/USD keeps hovering around 1.3400, lacking a clear bias.
- Investors await details from the US-Iran deal and interest rate decisions by the Fed and the BoE.
- Technically, the pair is in a consolidating phase, trapped between 1.3300 and 1.3500.
The British Pound (GBP) is trading practically flat against the US Dollar (USD) on Tuesday. The Doji candles at the 1.3400 area highlight an indecisive market, as traders await details on the US-Iran peace deal and monetary policy decisions by the US Federal Reserve (Fed) and the Bank of England (BoE) to make investment decisions.
US Vice President JD Vance affirmed earlier on the day that no tolls will be applied to vessels crossing the Strait of Hormuz and that nuclear inspectors will return to Iran. Investors, however, remain reluctant to take excessive risks, awaiting confirmation from Tehran.+
Markets are also attentive to the interest rate decisions from the Fed and the BoE to assess how major central banks will react to the peace deal. The Fed is expected to keep rates on hold on Wednesday, with the new Chairman Kevin Warsh, likely to adopt a more dovish stance than his predecessor Jerome Powell.
On Thursday, the BoE is highly likely to follow suit on rates and to hint at a steady monetary policy for the coming months. In this case, the vote split and the minutes of the meeting are expected to provide further details about the bank’s forward guidance.
Technical Analysis: Key levels are 1.3300 and 1.3500
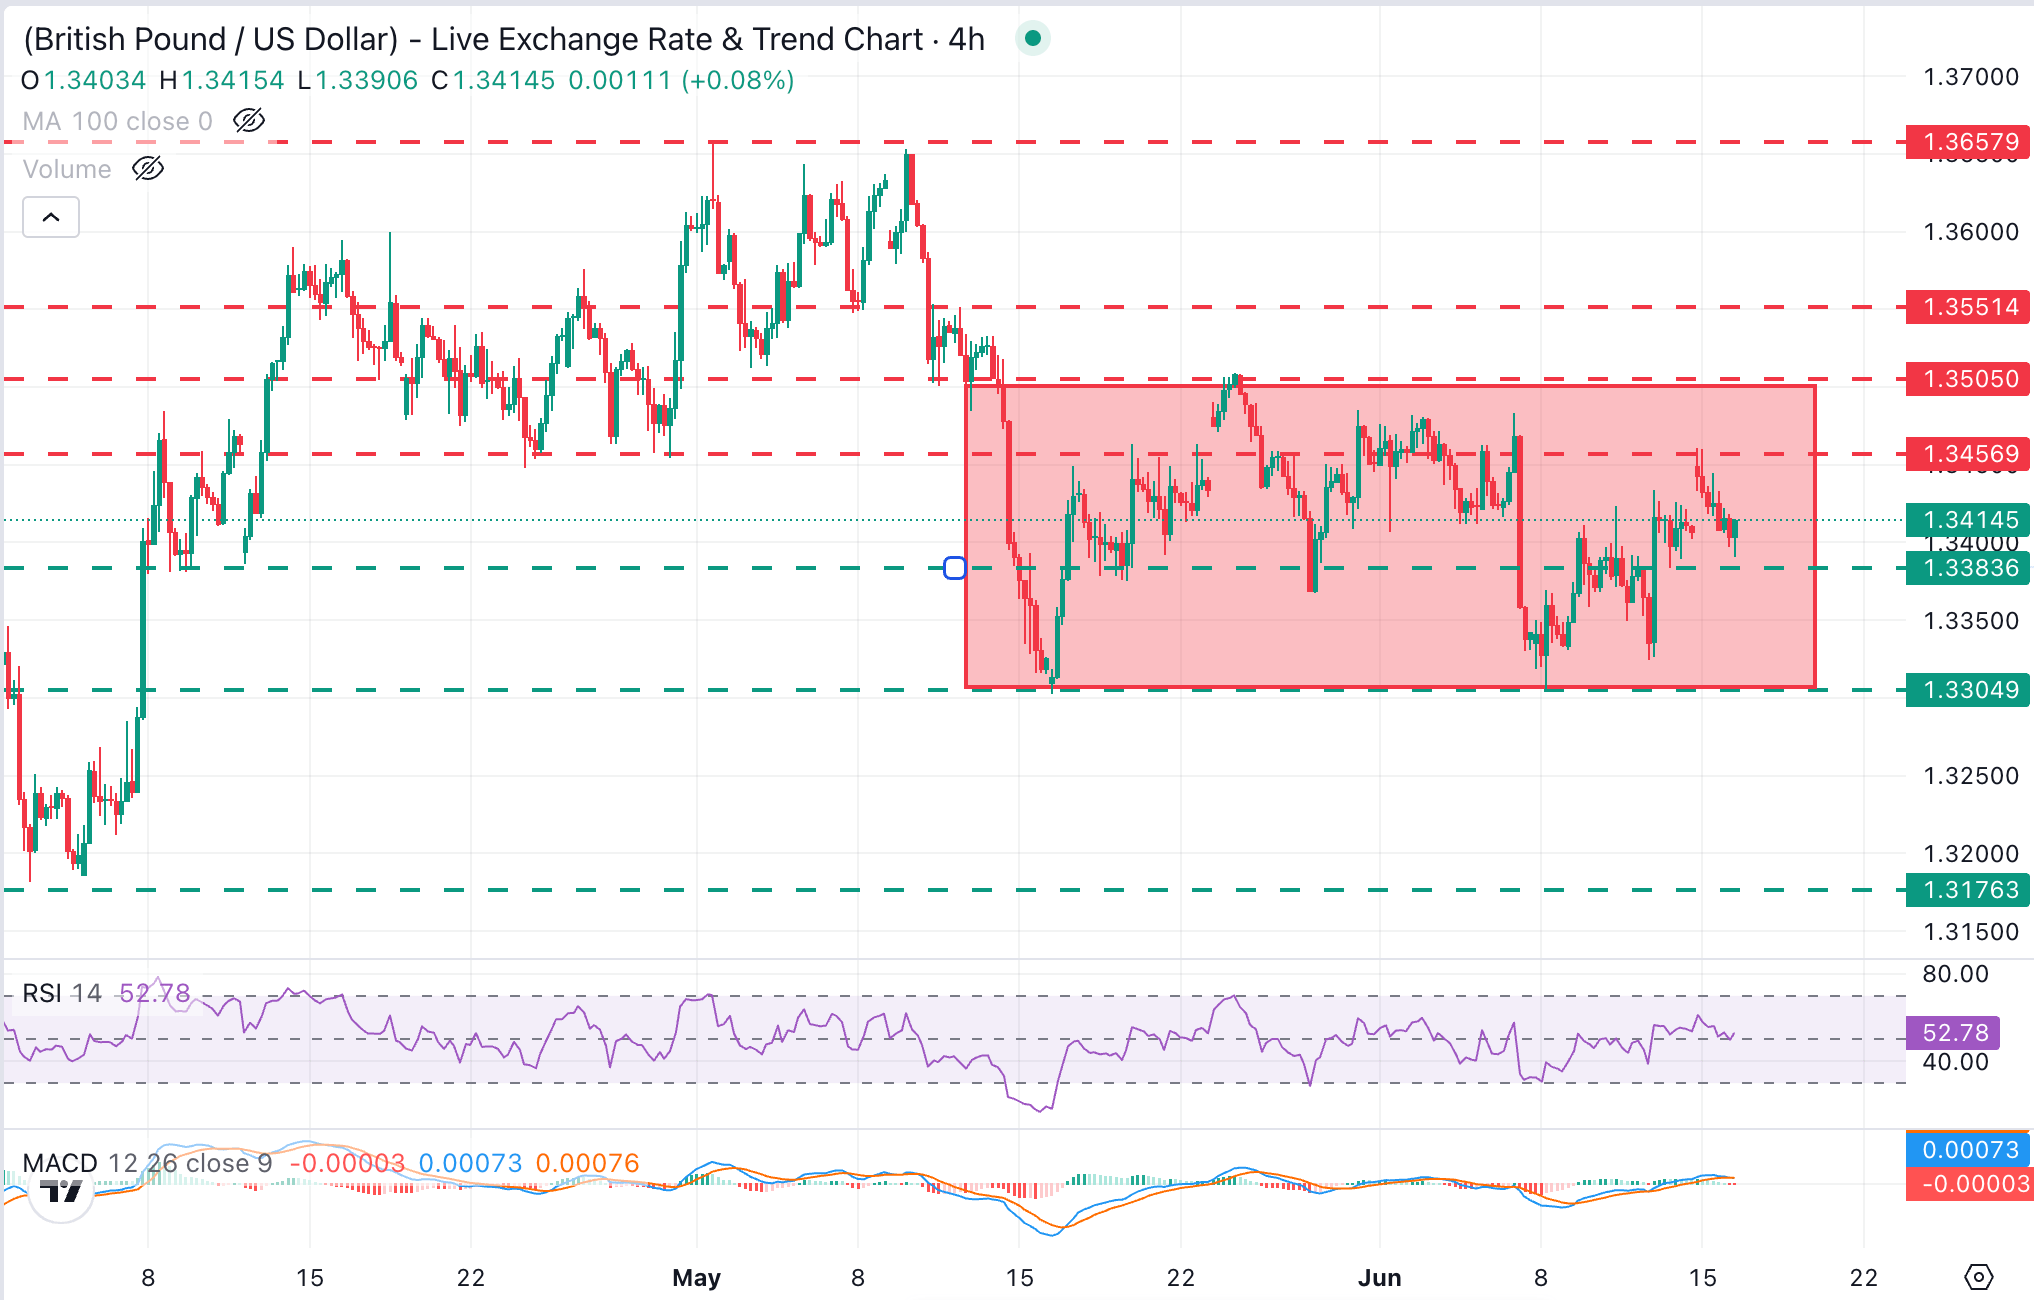
GBP/USD trades at 1.3410, halfway through the last four weeks’ range, between 1.3300 and 1.3500. Indicators in the 4-hour chart highlight a lack of clear momentum, with the Relative Strength Index (RSI) flat at the 50 midline and the Moving Average Convergence Divergence (MACD) fractionally below zero, together hinting at a consolidative bias.
The pair was rejected at the 1.3460 area on Monday, although the key resistance area lies between 1.3485 and 1.3505, which has held bulls since mid-May. Further up, the next target is the May 14 high, near 1.3550.
On the downside, Friday’s low, at 1.3380, might provide some support ahead of the bottom of the range, at the 1.3300 area (May 18, June 8 lows). Below here, the next bearish target is the late March to early April lows around 1.3170.
(The technical analysis of this story was written with the help of an AI tool.)
US Dollar Price Today
The table below shows the percentage change of US Dollar (USD) against listed major currencies today. US Dollar was the strongest against the Australian Dollar.
| USD | EUR | GBP | JPY | CAD | AUD | NZD | CHF | |
|---|---|---|---|---|---|---|---|---|
| USD | -0.03% | -0.00% | -0.05% | 0.09% | 0.18% | 0.07% | 0.03% | |
| EUR | 0.03% | 0.03% | 0.02% | 0.13% | 0.20% | 0.10% | 0.07% | |
| GBP | 0.00% | -0.03% | 0.00% | 0.11% | 0.16% | 0.08% | 0.04% | |
| JPY | 0.05% | -0.02% | 0.00% | 0.11% | 0.19% | 0.10% | 0.08% | |
| CAD | -0.09% | -0.13% | -0.11% | -0.11% | 0.08% | -0.03% | -0.06% | |
| AUD | -0.18% | -0.20% | -0.16% | -0.19% | -0.08% | -0.09% | -0.12% | |
| NZD | -0.07% | -0.10% | -0.08% | -0.10% | 0.03% | 0.09% | -0.03% | |
| CHF | -0.03% | -0.07% | -0.04% | -0.08% | 0.06% | 0.12% | 0.03% |
The heat map shows percentage changes of major currencies against each other. The base currency is picked from the left column, while the quote currency is picked from the top row. For example, if you pick the US Dollar from the left column and move along the horizontal line to the Japanese Yen, the percentage change displayed in the box will represent USD (base)/JPY (quote).