Global Markets
S&P 500 — US Large Cap Index
NASDAQ 100 — Tech Growth Index
Dow Jones — Industrial Average
FTSE 100 — UK Blue Chips
Euro Stoxx 50 — Eurozone Leaders
DAX 40 — German Equities
CAC 40 — French Market Index
Nikkei 225 — Japan Benchmark
Hang Seng — Hong Kong Index
Shanghai Composite — China Mainland
ASX 200 — Australian Market
TSX Composite — Canada Index
Nifty 50 — India Large Cap
STI Index — Singapore Market
KOSPI — South Korea Index
Bovespa — Brazil Equities
JSE Top 40 — South Africa Index
IPC Index — Mexico Market

S&P 500 — US Large Cap Index
NASDAQ 100 — Tech Growth Index
Dow Jones — Industrial Average
FTSE 100 — UK Blue Chips
Euro Stoxx 50 — Eurozone Leaders
DAX 40 — German Equities
CAC 40 — French Market Index
Nikkei 225 — Japan Benchmark
Hang Seng — Hong Kong Index
Shanghai Composite — China Mainland
ASX 200 — Australian Market
TSX Composite — Canada Index
Nifty 50 — India Large Cap
STI Index — Singapore Market
KOSPI — South Korea Index
Bovespa — Brazil Equities
JSE Top 40 — South Africa Index
IPC Index — Mexico Market

AED • EUR • GBP • USD IBANs   |   CROSS BORDER FX   |   LOCAL CURRENCIES   |   GLOBAL COVERAGE
GoldMarketsTechnical Analysis

Gold drops over 2% as Trump plays down the need for an Iran deal

  • Gold struggles to attract buyers as hawkish Fed expectations continue to dominate market sentiment.
  • Markets now fully price in a December Fed rate hike following stronger US inflation and hawkish Fed remarks.
  • XAU/USD remains bearish below the 20-day SMA, while the RSI near 41 points to weak buying momentum.

Gold (XAU/USD) slips back below $4,000 on Thursday, giving up most of last week’s gains as bets on more aggressive Federal Reserve (Fed) interest rate hikes lift the US Dollar (USD) to a fresh year-to-date high. At the time of writing, XAU/USD trades around $3,889, down more than 2% on the day.

Selling pressure intensified after US President Donald Trump wrote on Truth Social, “We don’t need a deal with Iran. Those days have long since passed.” Oil prices turned higher after his remarks, adding to inflation concerns.

Data released on Thursday showed that US Initial Jobless Claims rose to 200K from 191K the previous week, above the 195K forecast. The four-week average held steady at 195.25K. The rise in claims took some steam out of the US Dollar’s rally. The US Dollar Index (DXY), which tracks the Greenback against a basket of six major currencies, trades near 102.95, off its high of 103.08.

Fed Governor Christopher Waller put a 50-basis-point (bps) hike in December on traders’ radar before Tuesday’s US inflation report. Waller said a half-point hike could be needed if October core Consumer Price Index (CPI) came in “around 0.3% or higher.” And that’s what happened. Core CPI rose 0.3% on the month, above the 0.2% forecast, while headline CPI rose 0.4%, beating the 0.3% estimate.

Markets fully price in December Fed hike

Analysts at MUFG/BTMU note that “there are currently around 28bps of hikes priced by December, and 43bps of hikes priced by the following meeting in January,” which “indicat[es] that even if the Fed hikes by 25bps in December, it is now expected to quickly follow up with another 25bps hike at the start of next year.”

ING strategists add that “the combination of hawkish Fed speak and a US CPI beat earlier this week continues to pay dividends for the Dollar,” with DXY now “back at Liberation Day (April 2025) levels.” They stress that “real front-end rate differentials [are] continuing to fuel strong Dollar momentum” and that “this remains a rates-driven move, with contained excessive USD strength relative to short-term fair value currently built in.”

The prospect of higher borrowing costs takes some shine off Gold as investors favour assets that pay interest. Traders now turn to the Producer Price Index (PPI) due on Friday, with several Fed officials also set to speak over the rest of the week.

Technical analysis: Weak RSI keeps downside risks in focus
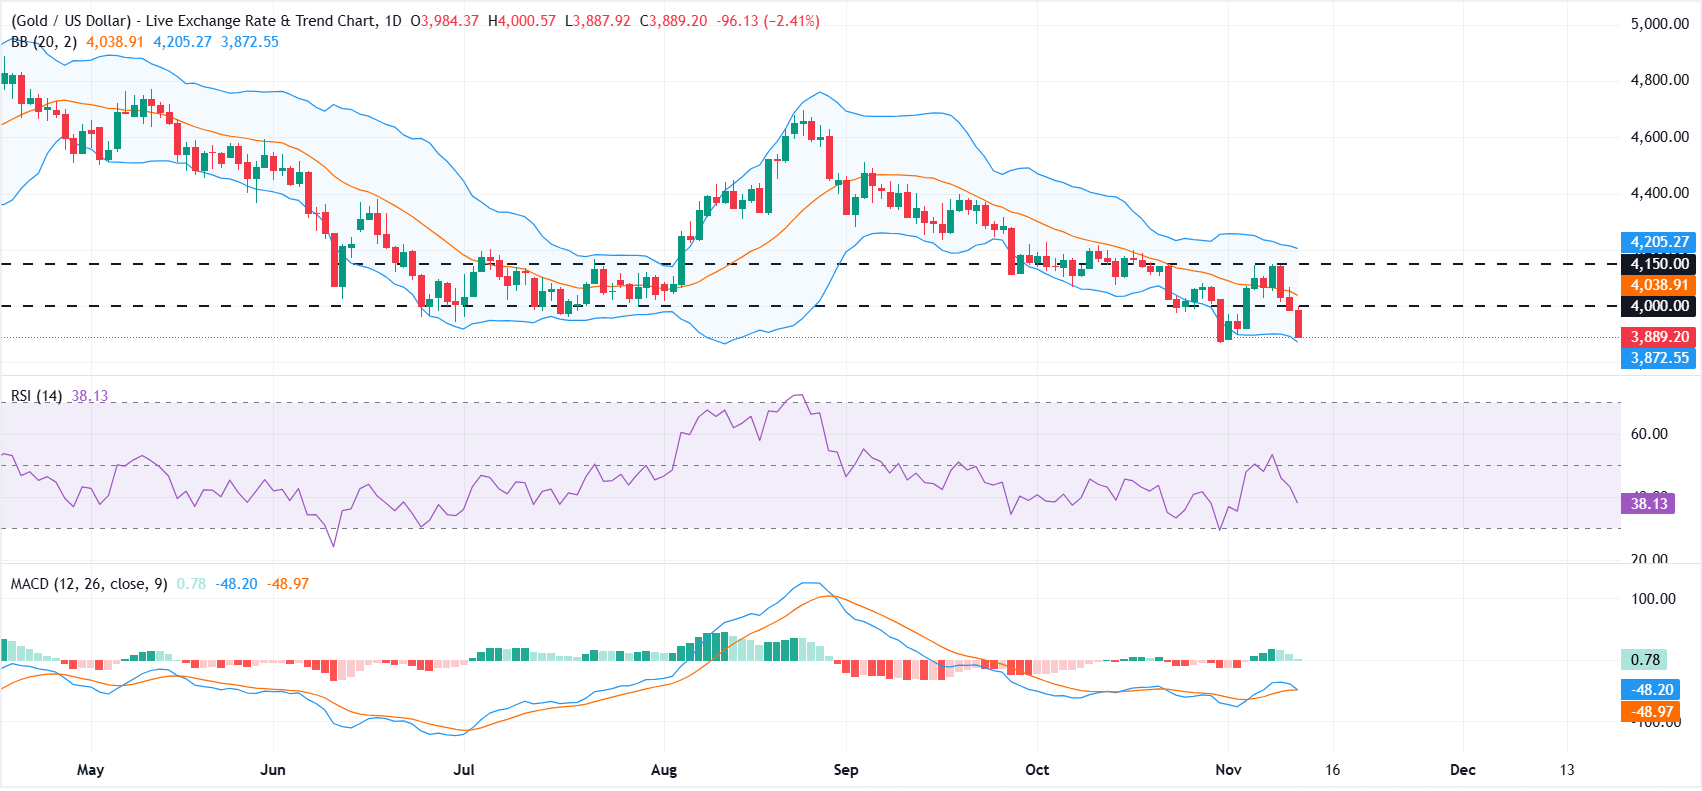
On the daily chart, XAU/USD remains bearish as it sits below the 20-day Simple Moving Average (SMA) of the Bollinger Bands at $4,042. Momentum is relatively subdued, with the 14-day Relative Strength Index (RSI) hovering around 41, suggesting only modest buying interest despite a mildly positive Moving Average Convergence Divergence (MACD) reading above zero.

On the topside, initial resistance is seen at $4,000, followed by the mid-Bollinger 20-day SMA at $4,042. A sustained break above these levels would open the way toward $4,150 and the Bollinger upper band at roughly $4,199. On the downside, immediate support appears at the lower Bollinger band near $3,885, and any decisive move below that zone is likely to reinforce the prevailing bearish bias and expose deeper retracement levels.

Register a Revolut Business Account
```

Market Analysis & Disclaimer

The market information, analysis, commentary, forecasts and opinions contained in this publication are provided by Octalas Group Ltd on behalf of Today Markets and Currency Hedger using information and data obtained from sources believed to be reliable. However, Octalas Group Ltd, Today Markets and Currency Hedger do not warrant or guarantee the accuracy, completeness or timeliness of the information presented and accept no responsibility for any loss or damage arising from reliance upon information contained herein, to the extent permitted by applicable law.

Market forecasts, expectations and opinions are based on analysis of available information and a number of assumptions regarding economic, financial, political and market conditions. Such assumptions may prove to be incorrect, and actual market developments may differ materially from those described or anticipated.

Nothing contained in this publication constitutes investment advice, financial advice, a personal recommendation, an offer, solicitation or invitation to buy, sell or otherwise transact in any financial instrument or investment product. The information is provided for general informational and educational purposes only and does not take into account the investment objectives, financial situation, experience or particular circumstances of any individual reader.

Past performance is not indicative of future results. Financial markets, including foreign exchange, commodities, equities, derivatives and other financial instruments, involve risk and prices can move rapidly. Readers should conduct their own independent research and, where appropriate, obtain advice from an appropriately authorised financial professional before making any investment or trading decision.

Where this publication refers to Today Markets, it represents market news, research, analysis and commentary published for informational purposes. Where Currency Hedger is referenced, it represents commentary concerning foreign exchange, currency exposure, international payments and hedging-related topics. References to particular financial instruments, markets, companies, currencies or commodities should not be interpreted as a recommendation to transact in them.

Octalas Group Ltd, Today Markets and Currency Hedger may have commercial interests or relationships with businesses, financial-service providers, technology providers or other market participants mentioned in their publications. Where relevant, such relationships or interests may create potential conflicts of interest. Appropriate measures are intended to be taken to ensure that published analysis and commentary are presented objectively and that commercial considerations do not determine the substance of market analysis.

The views expressed in this publication are those of the author or contributors at the time of publication and may change without notice as market conditions develop. Readers should not assume that any information contained herein has been updated following publication.

Related Articles

Leave a Reply

Your email address will not be published. Required fields are marked *

Back to top button