
- The pair is testing the +1 standard deviation line of the anchored VWAP, calculated from 2 January 2025
- Canada is one of the world’s leading oil exporters
Recommendation:
- Long position on USDCAD at market price
- SL: 1.35575
- Target Price: 1.38880
Opinion:
The USD/CAD pair is currently trading around 1.3647, within a support zone defined by key volume patterns from the volume profile built since the start of 2025. Both the Stop Loss (1.35575) and Take Profit (1.38880) levels have been set in relation to the largest volume clusters visible on the profile – zones of historically high market activity which act as strong technical barriers. The price is approaching the lower boundary of a multi-month consolidation phase, and the 1.3620–1.3660 zone has repeatedly acted as a support level triggering upward movements, which confirms the validity of opening a technical long position.
The key fundamental argument is the CAD’s dependence on oil prices – Canada is one of the leading exporters of crude oil, and the Canadian dollar functions de facto as a petrodollar, meaning that any further falls in oil prices directly weaken the CAD and support an increase in USD/CAD. Given the growing oversupply in the oil market and the expected increase in production by OPEC countries, the risk of continued pressure on oil prices remains real, which further favours the long side on this pair, following a fairly significant depreciation over the long term.
Although the money markets are pricing in a more hawkish shift in the Bank of Canada’s stance in the future compared to the current one, the spread in short-term yields between the US and Canada (1M: 3.64 vs. 2.25) still points to a carry trade in favour of the USD. However, we recommend exercising particular caution, as the fundamental environment for this pair may change rapidly and thus undermine the current basis for this recommendation.
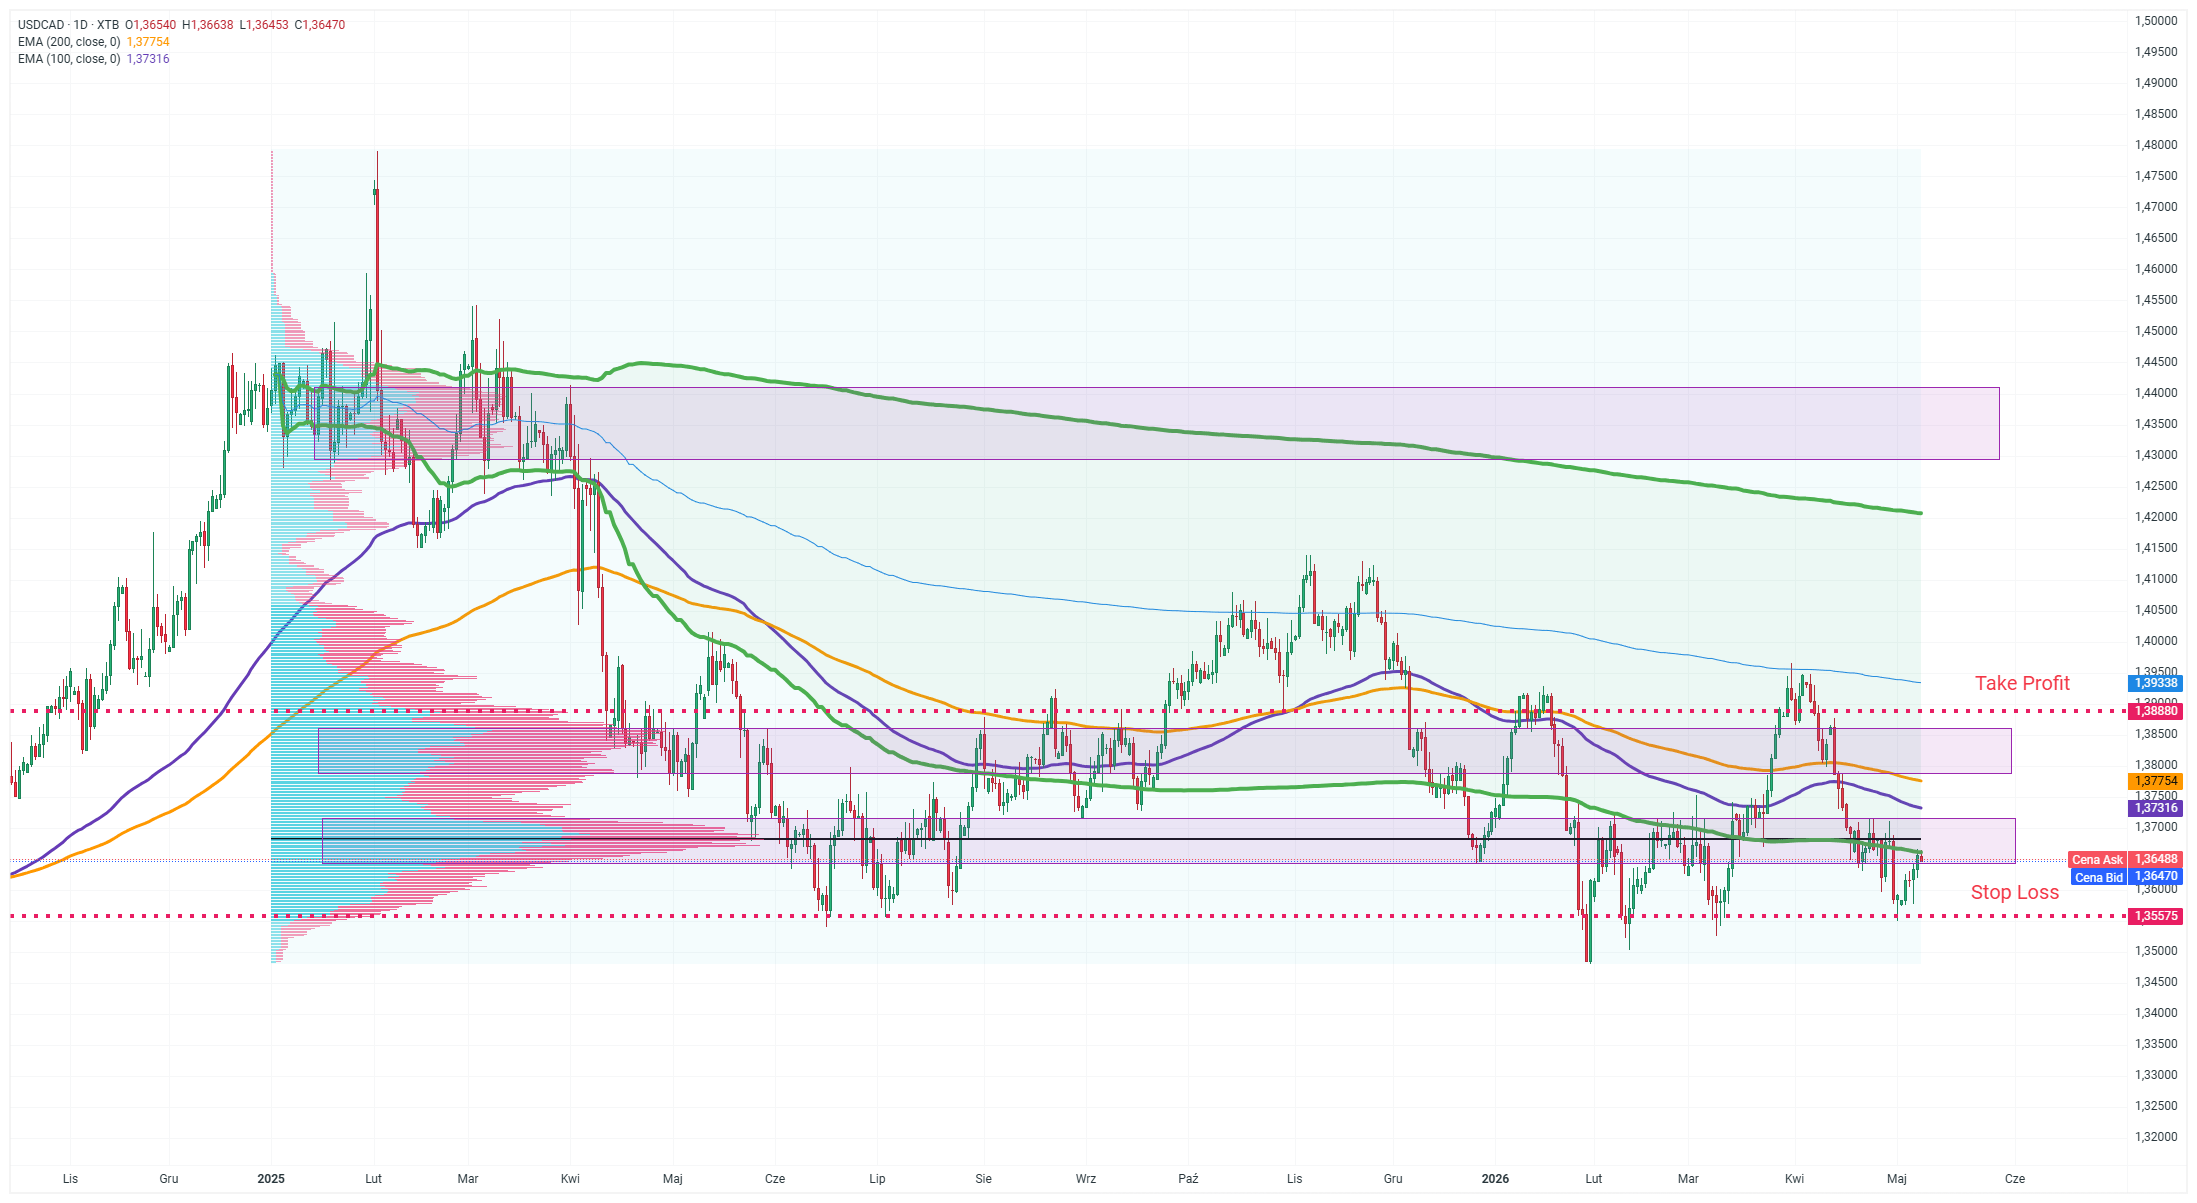
Source: xStation
Methodology and assumptions:
The recommendation is based on a technical and fundamental analysis of the USD/CAD chart. Classical technical analysis was used to assess the situation and analyse the trend.