iangle… up above the sky!”
In our previous update, we highlighted a contracting triangle forming between 91K–95K, anticipating a breakout toward the 98K–100K zone.
That played out well — Bitcoin rallied to 97,944 as Yellow Wave-1, just shy of the 98K mark.
As expected, it faced resistance and pulled back again holding the important support 90-92 K range.
This zone aligned exactly as expected — acting as the bounce pad.
Importantly, Bitcoin respected:
- Wave-E low: ~92,850
- Wave-A low: ~91,669
5 Waves from the Bottom of 74-75K to 107K – What an amazing rally.
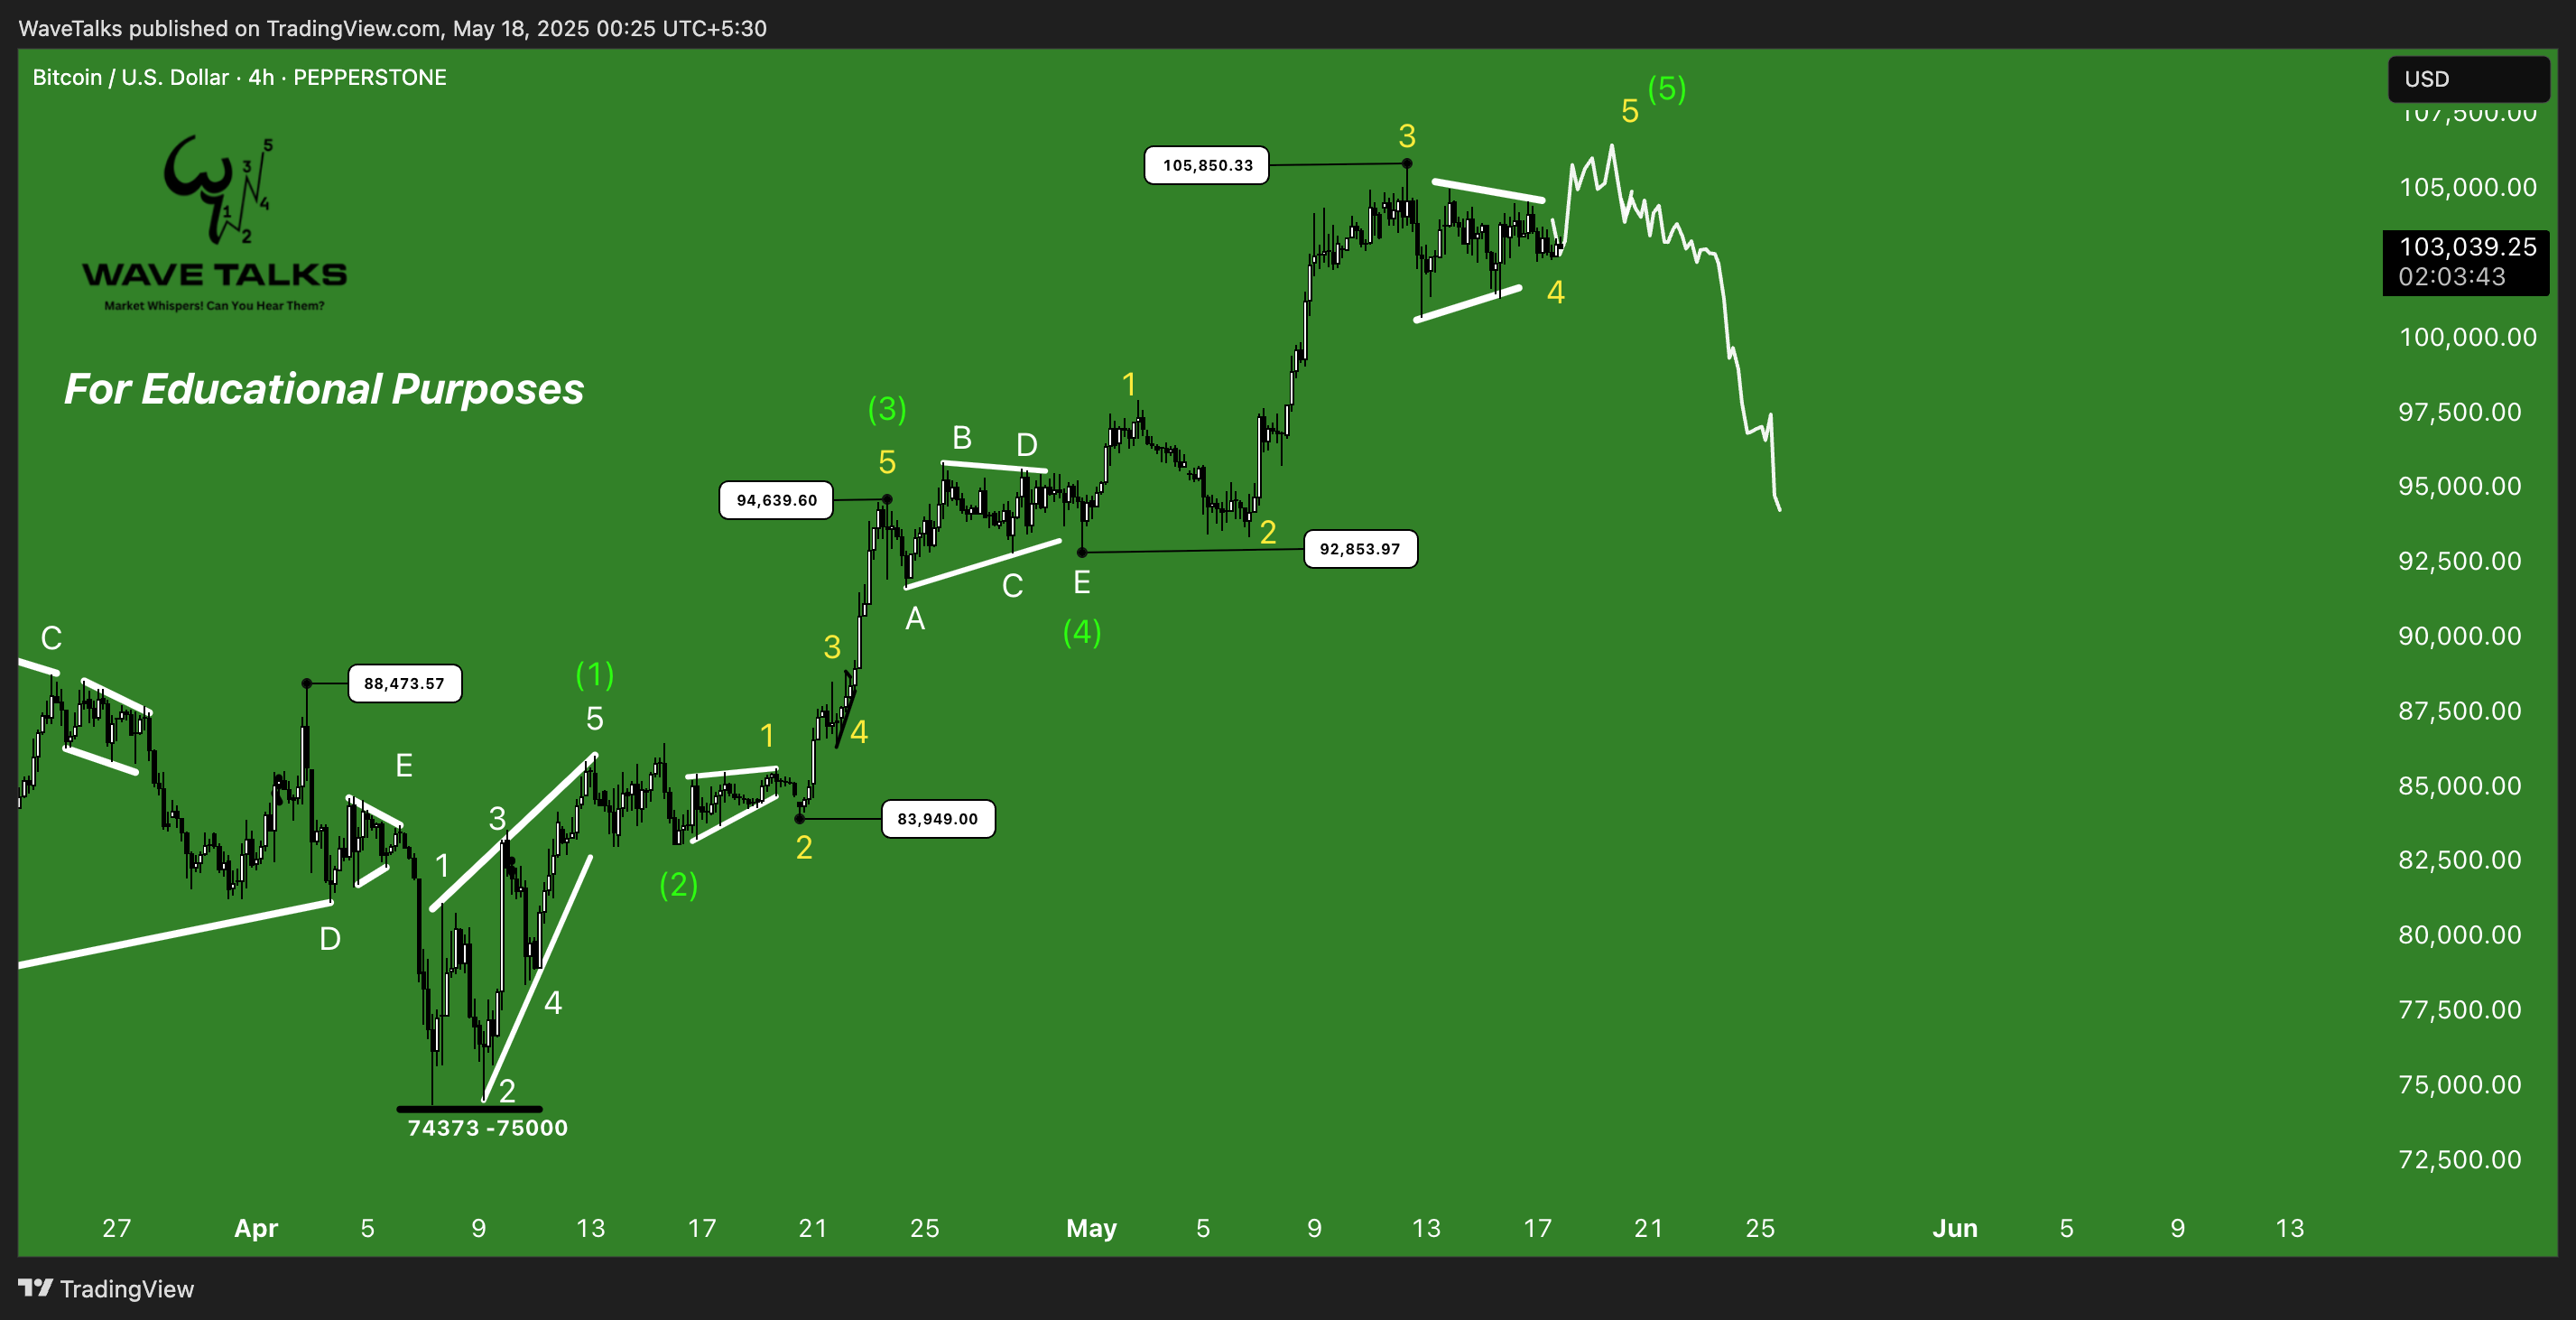
Bounce from 90-92K Zone
From the Wave-E lows of 92853, Bitcoin has bounced sharp upside to 105K forming Wave 3 in Yellow Wave count upside and later unfolded a triangle in Yellow Wave-4 bottoming at 102,586.
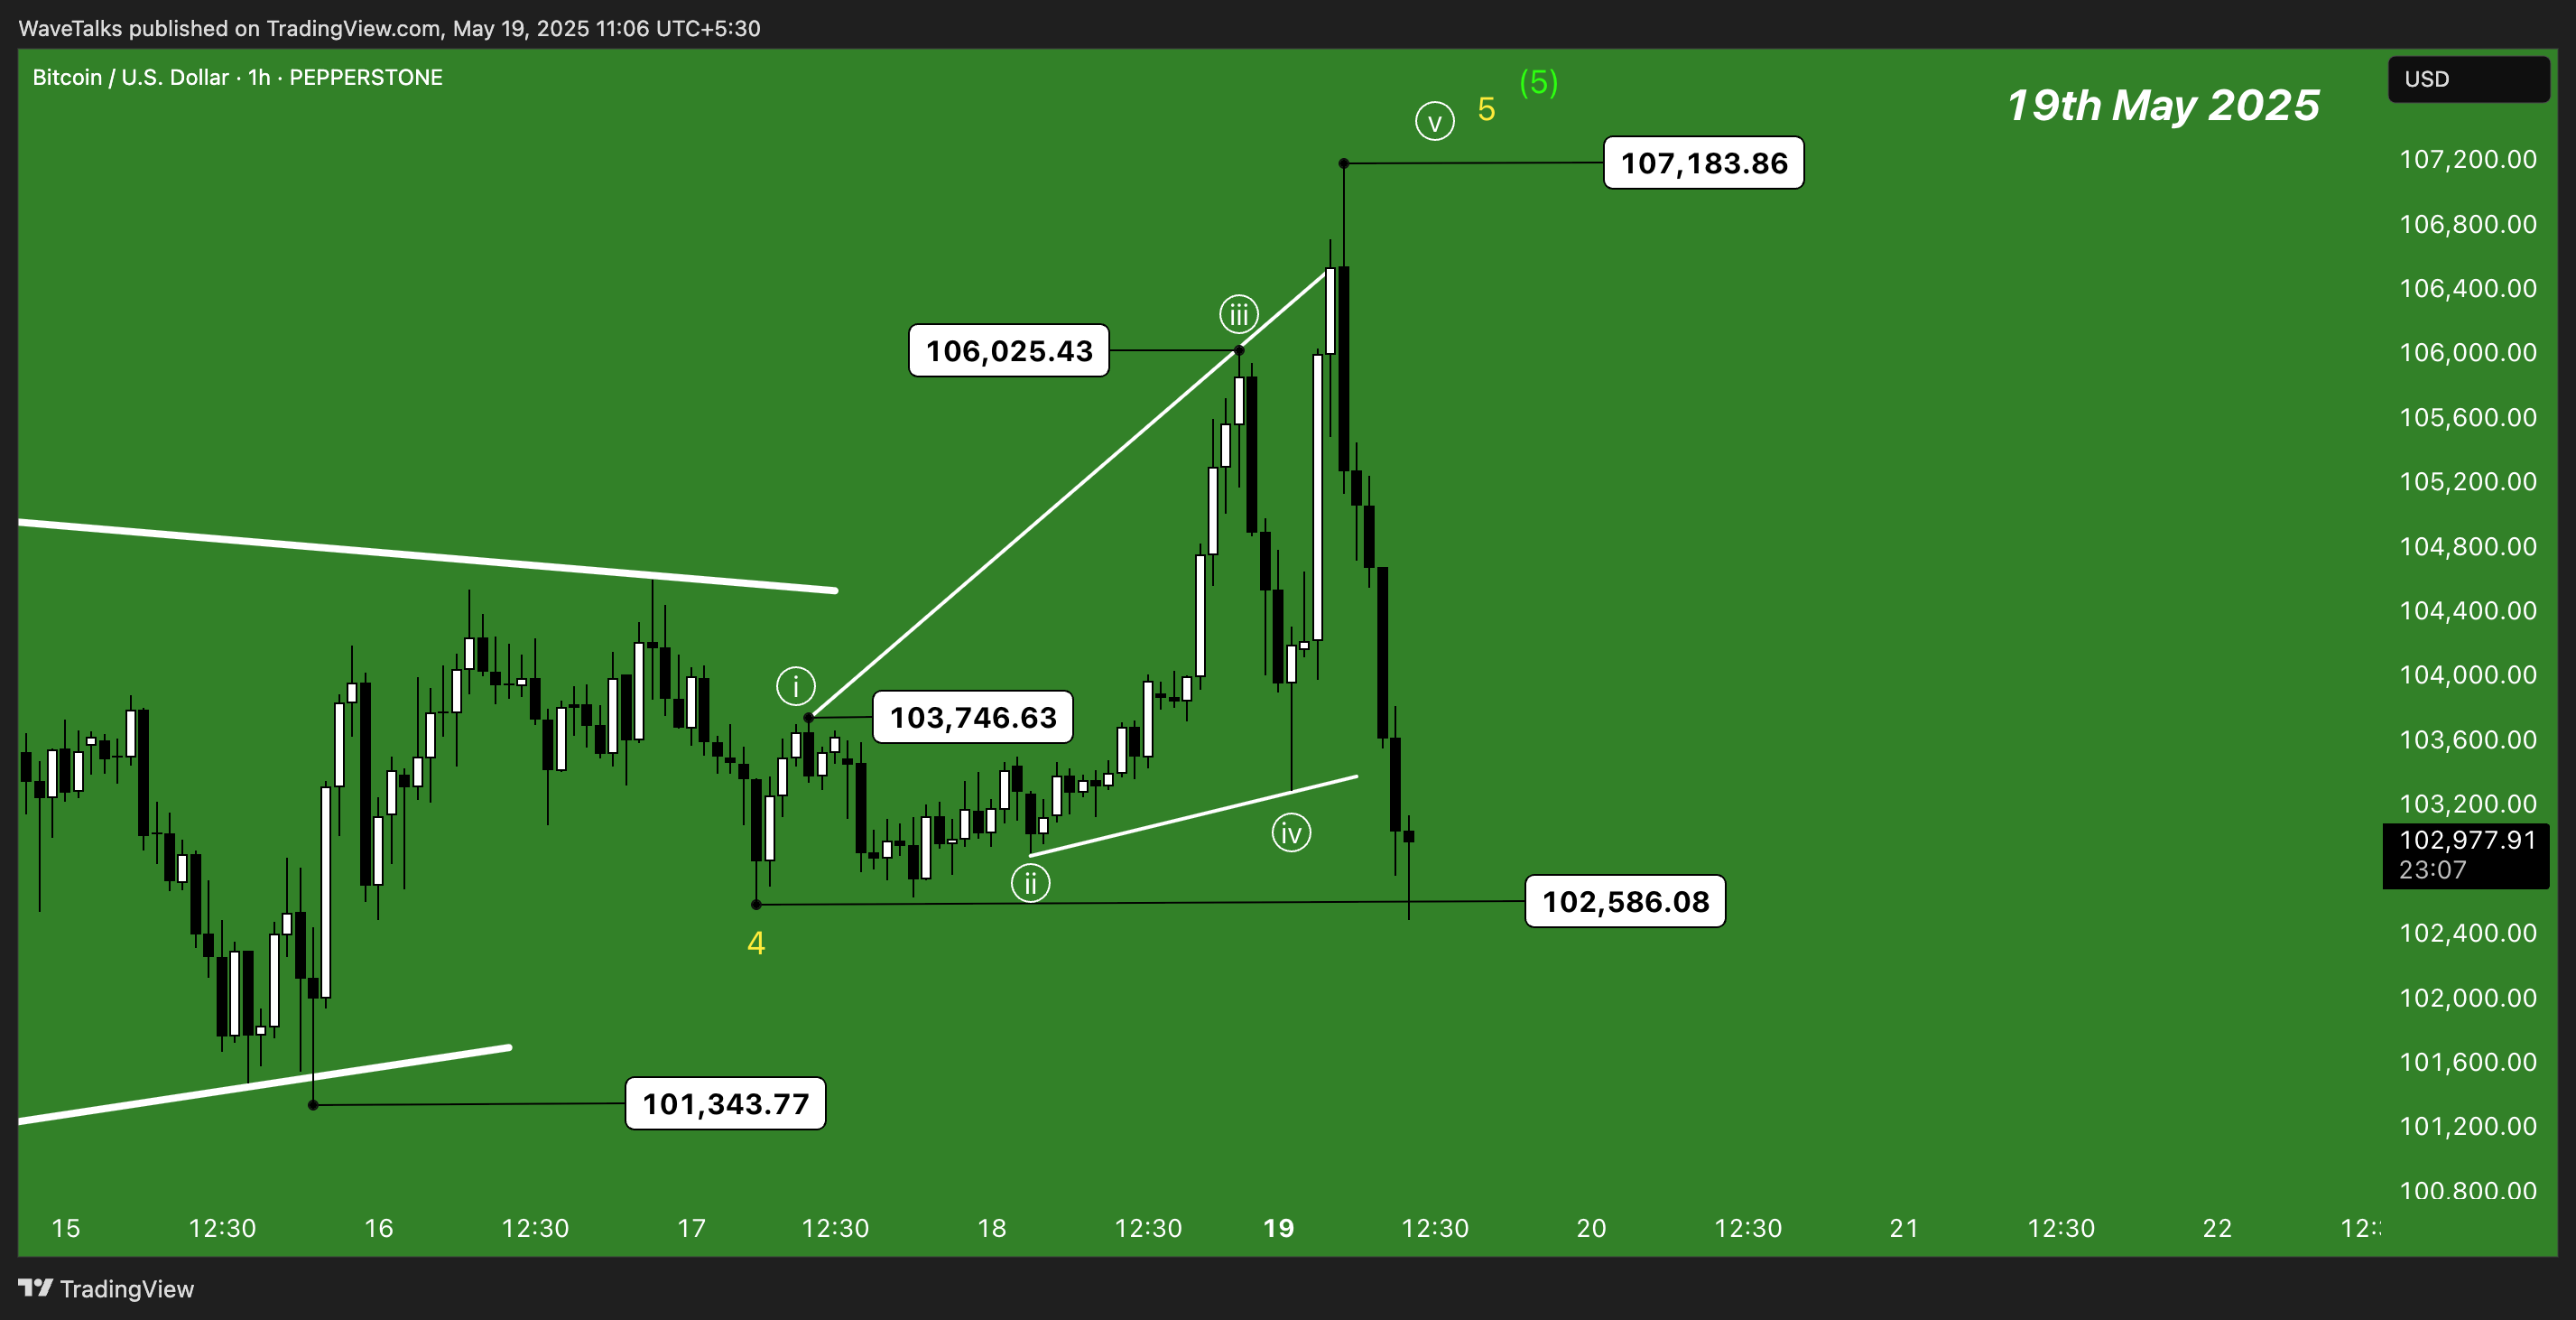
However, this rise towards 107,183 can be the final wave 5 upside in Yellow wave count if 100-102 K zone of Yellow Triangle Wave is breached downside.
The important zone – 100-102K
Holding 100K–102K keeps the bullish setup alive. But if this zone breaks down, we should prepare for a deeper pullback toward 90K–92K. If that fails, the next key support is seen at 86K–88K.
Key Bitcoin levels
- 92,853 – Important low (Wave-E).
- 107K–109K – Critical target/resistance zone.
- 100K–102K – Support to hold for bullish continuation.
- 90K–92K – Deeper support.
- 86K–88K – Breakdown level if 90K fails.
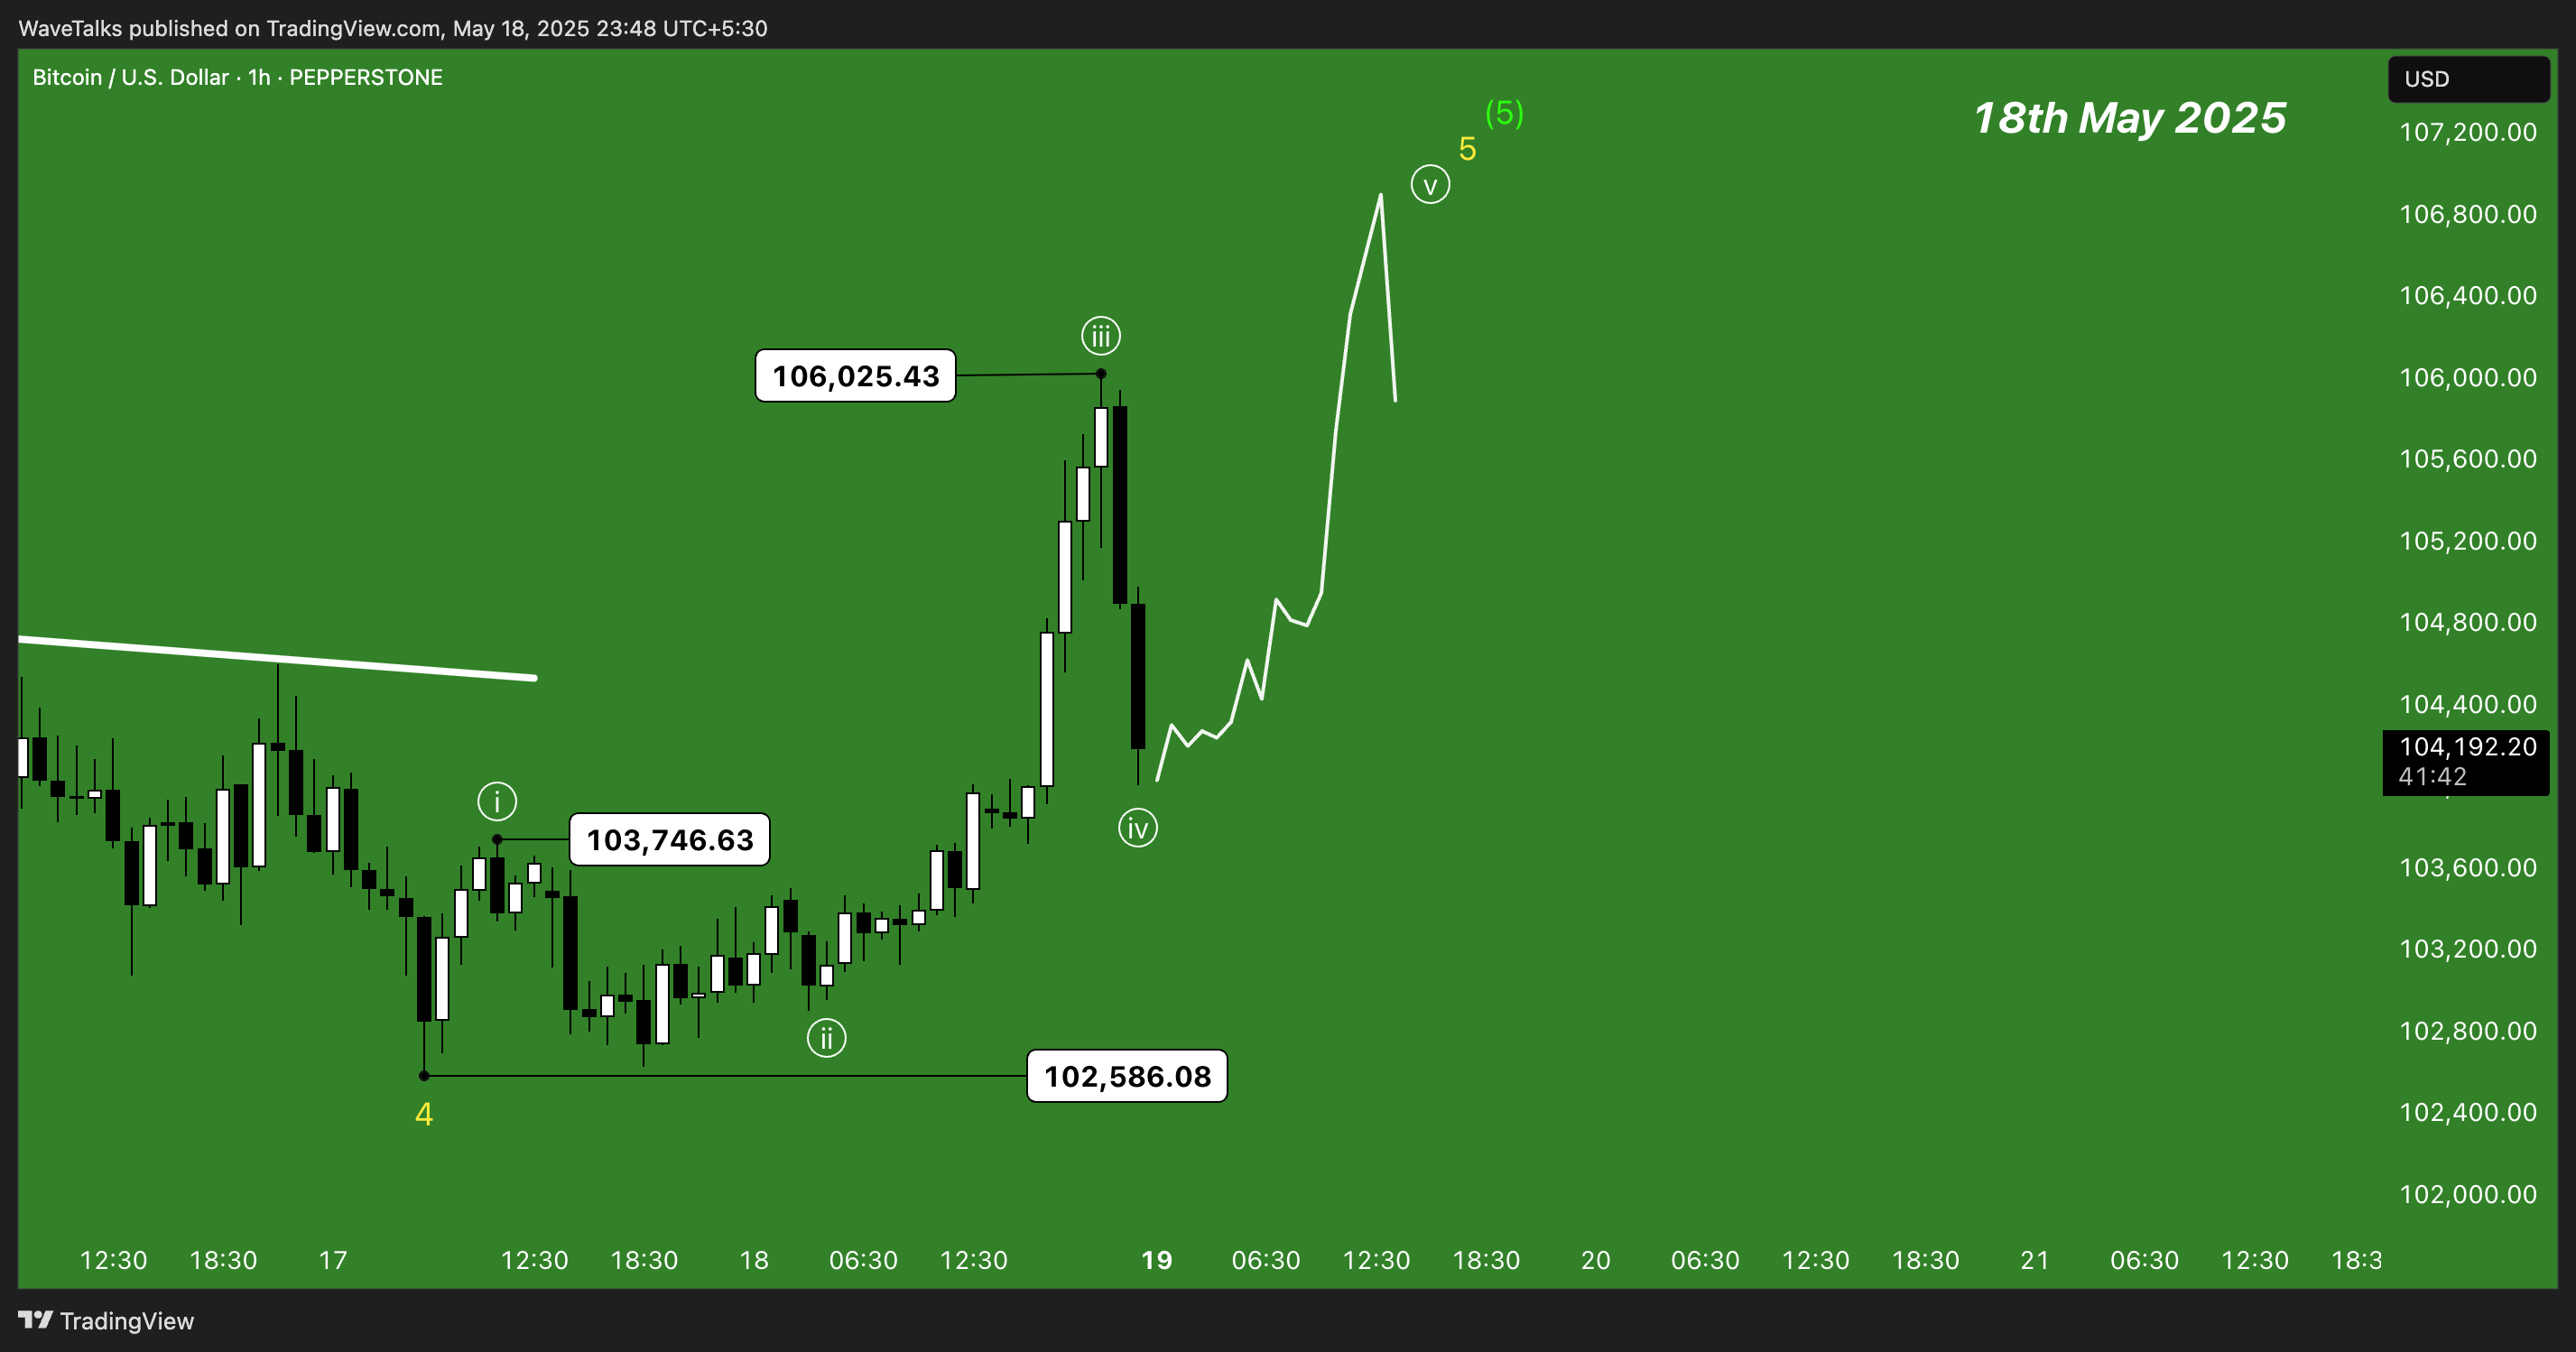
One hour chart – White waves unfolding above 102,586 in lower degree within yellow wave -5 – 18th May 2025
White Waves Is it done at 107,183 Highs – 19th May 2025
Conclusion
Bitcoin followed the triangle breakout exactly as projected — rallying, pulling back, and bouncing again – all unfolding an impulsive 5 Yellow Wave Count.. & Even 5th Unfolded in White Wave Count further…
But the next few sessions are critical:
- If it falls below 100-102K zone, a dip toward 90–92K zone is most likely to unfold & provide next support.
- Falling below 90-92K Zone…We look for 88K as next support.
Stay tuned as WaveTalks continues to track this unfolding structure.