Chart of The Day – Is The USD/JPY in a stable trend or at a turning point?

USDJPY is trading slightly lower this morning at 162.70 (-0.15%) after hitting new multi-year highs around 163, as the market awaits the key U.S. payrolls report.
Context of Today’s NFP Data
Today’s June payrolls report is the main catalyst of the day—the consensus expects a marked slowdown to about 110,000 jobs following a surprisingly strong May reading of 172,000, with the unemployment rate holding steady at 4.3% and wage growth accelerating to 3.5% y/y. The market is trying to assess whether May’s surge represented a genuine labor market recovery or merely a one-off effect (including the World Cup in the U.S.). Employment growth this year has averaged above 80,000, which supports the scenario of a resilient labor market. CBA warns that another positive surprise could push USD/JPY toward 165 and test the Japanese authorities’ determination to defend the yen, while a weak reading (below 70,000–90,000) would ease pressure on the Fed to remain hawkish and could trigger a downward correction in the pair.
Technical Analysis
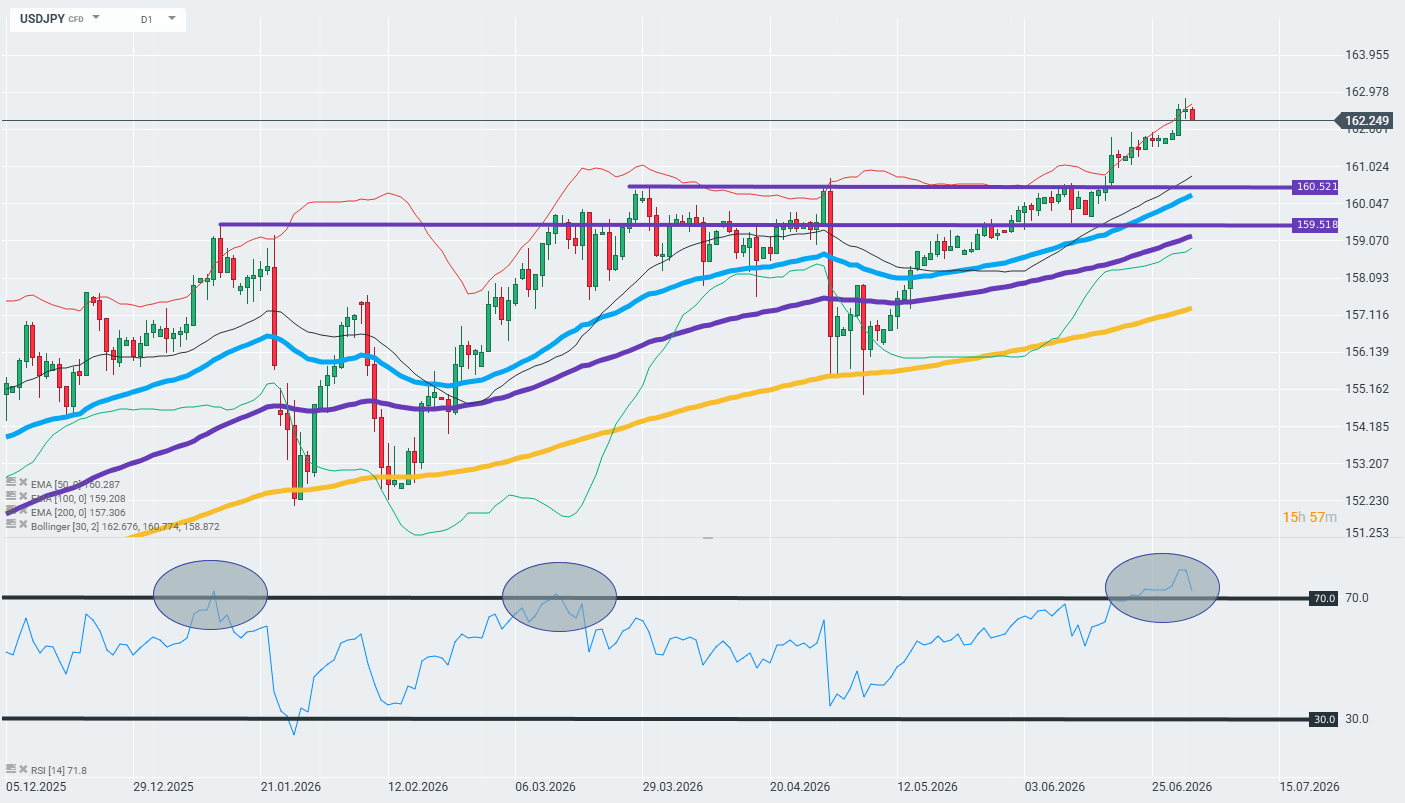
The price broke through key resistance levels at 159.52 and 160.52 JPY with momentum, moving clearly above the 50-day EMA (160.29), the 100-day EMA (159.21), and the 200-day EMA (157.31), confirming a strong uptrend. However, the RSI at 71.8–76.2 signals overbought conditions on the daily chart, which historically has preceded short-term consolidations or corrections, especially near multi-year highs. The trend remains clearly bullish for the dollar (bearish for the yen), and the 162–163 range also represents an area of heightened risk of currency intervention by Japanese authorities. Source: xStation
A Brief Look at Data from Japan
The Bank of Japan raised its policy rate to 1.0% in June—the highest level in 31 years—but the market does not expect another hike until the October–December 2026 window, even though about 90% of economists anticipate one more hike by December. This slow pace of policy normalization by the BoJ, coupled with the hawkish stance of the Fed, is the main structural reason why the interest rate differential between the U.S. and Japan remains wide and is sustaining the yen’s long-term downward trend—verbal interventions by Japanese officials have so far failed to permanently reverse this trend.