Commodity Wrap – Oil, Gold, Natgas, Cocoa

Key takeaways
- Oil: Prices are falling sharply (Brent below $81) due to a temporary US-Iran peace agreement and the prospect of reopening the Strait of Hormuz, which, combined with weakening demand in China, forced Goldman Sachs and Morgan Stanley to lower their price forecasts for the end of 2026.
- Gold: Prices are rebounding above $4,340 driven by a drop in Fed rate hike expectations and plans by 45% of central banks to increase reserves, although the precious metal remains about 20% below its February peaks.
- Natural Gas (Natgas): Futures are recovering losses thanks to record LNG export flows (19.1 bcf/d) and the return of positive prices in the Permian Basin, though high inventories and rising short positions could cap further gains.
- Cocoa: The price is attempting to return to an upward trend toward $4,300 amid fears over the destructive impact of El Niño on African crops this fall, despite the current season being projected to end with a record surplus of 400,000 tons.
Oil
- Geopolitical breakthrough and price slump: WTI and Brent oil prices saw sharp declines (reaching two-month lows), reacting to the announcement of a temporary peace agreement between the US and Iran.
- Donald Trump announced the reopening of the strategic Strait of Hormuz, which is to take place after the formal signing of the agreement in Switzerland and will initiate a 60-day nuclear negotiation period. The signing of the agreement is expected this coming Friday, June 19.
- However, many doubts are arising due to leaks regarding the agreement and many inconsistencies in the context of further oversight over the Strait of Hormuz and the collection of fees.
- Despite this, information appeared indicating that the United States is lifting the naval blockade, which may be a sign of will and proof of trust before Friday’s summit in Geneva.
- Brent oil is losing over 3% during Tuesday’s session, and prices are falling below $81 per barrel.
- Morgan Stanley and Goldman Sachs officially lowered their price forecasts for oil for the last quarter of 2026 due to a faster-than-expected return of supplies from the Persian Gulf region. Goldman Sachs reduced its forecast for Brent oil to $80 per barrel.
- Destruction of refinery demand in China: Last month, Chinese refineries reduced production to its lowest level in nearly 4 years, which was the effect of a drop in crude imports to an 8-year minimum caused by the earlier naval blockade. China is strengthening its position as a global “swing importer”.
- In January, oil imports amounted to over 55 million tons, which translated to about 13 million barrels per day, while currently, imports are falling to 33 million tons, which is a level of about 8 million barrels per day.
- Tensions in Eastern Europe: Ukrainian drones successfully hit a refinery in Moscow, which constitutes another blow to Russian energy infrastructure and deepens fuel shortages in the country.
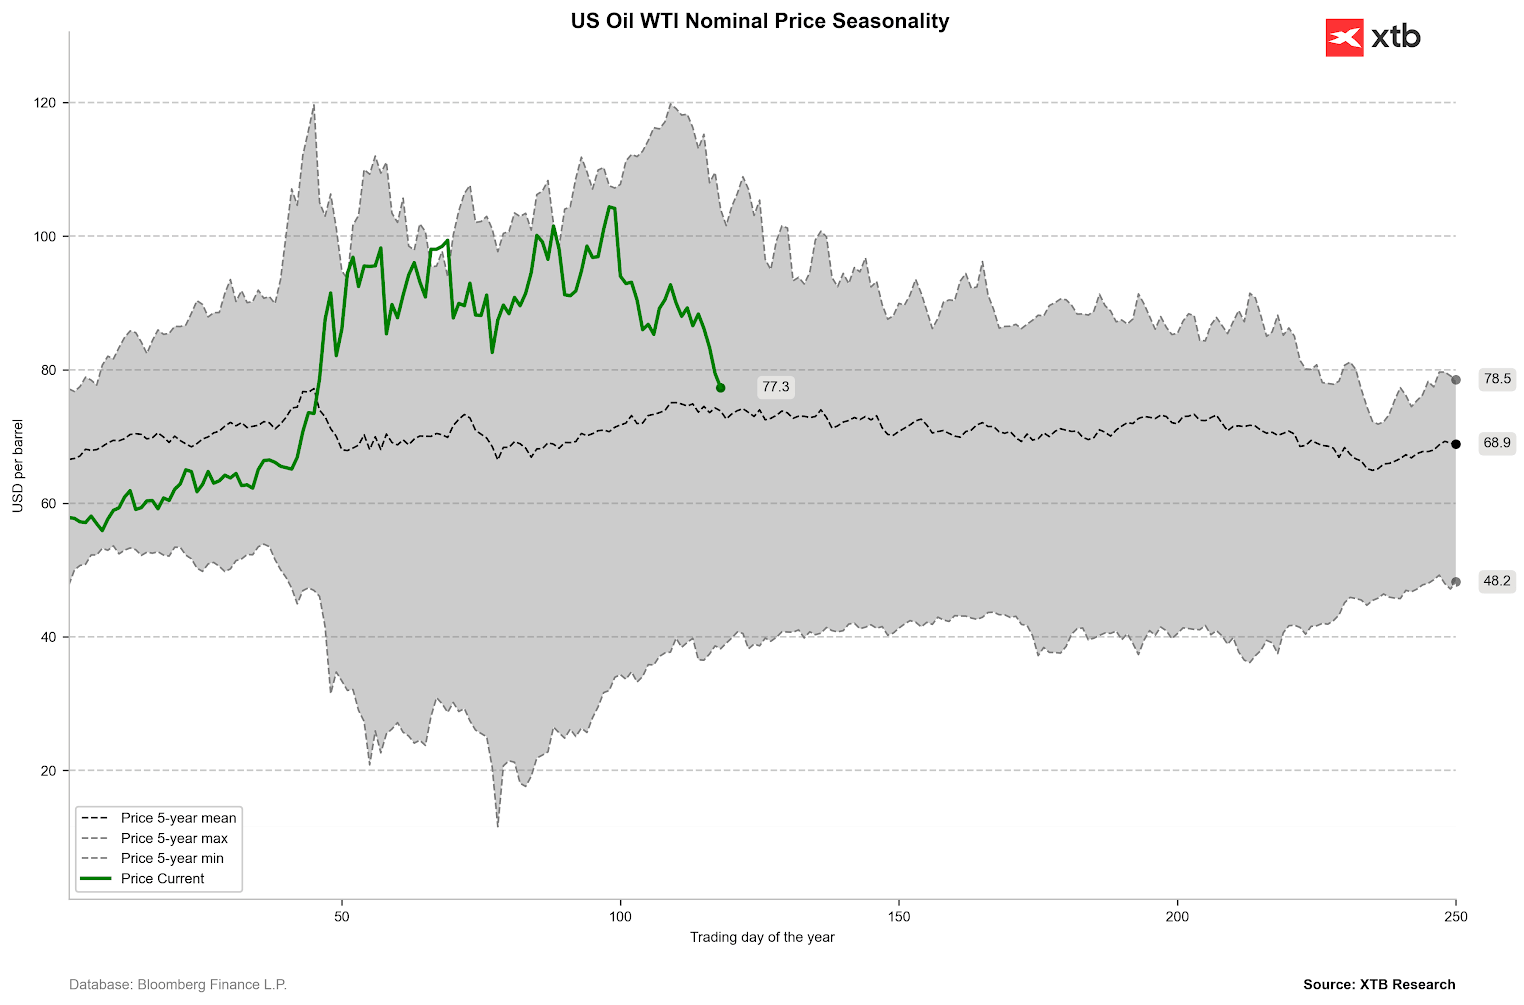
Nominally, we observe the price approaching the 5-year average. It is worth noting that the coming weeks or months, on average over the last 5 years, have brought declines. Source: Bloomberg Finance LP, XTB
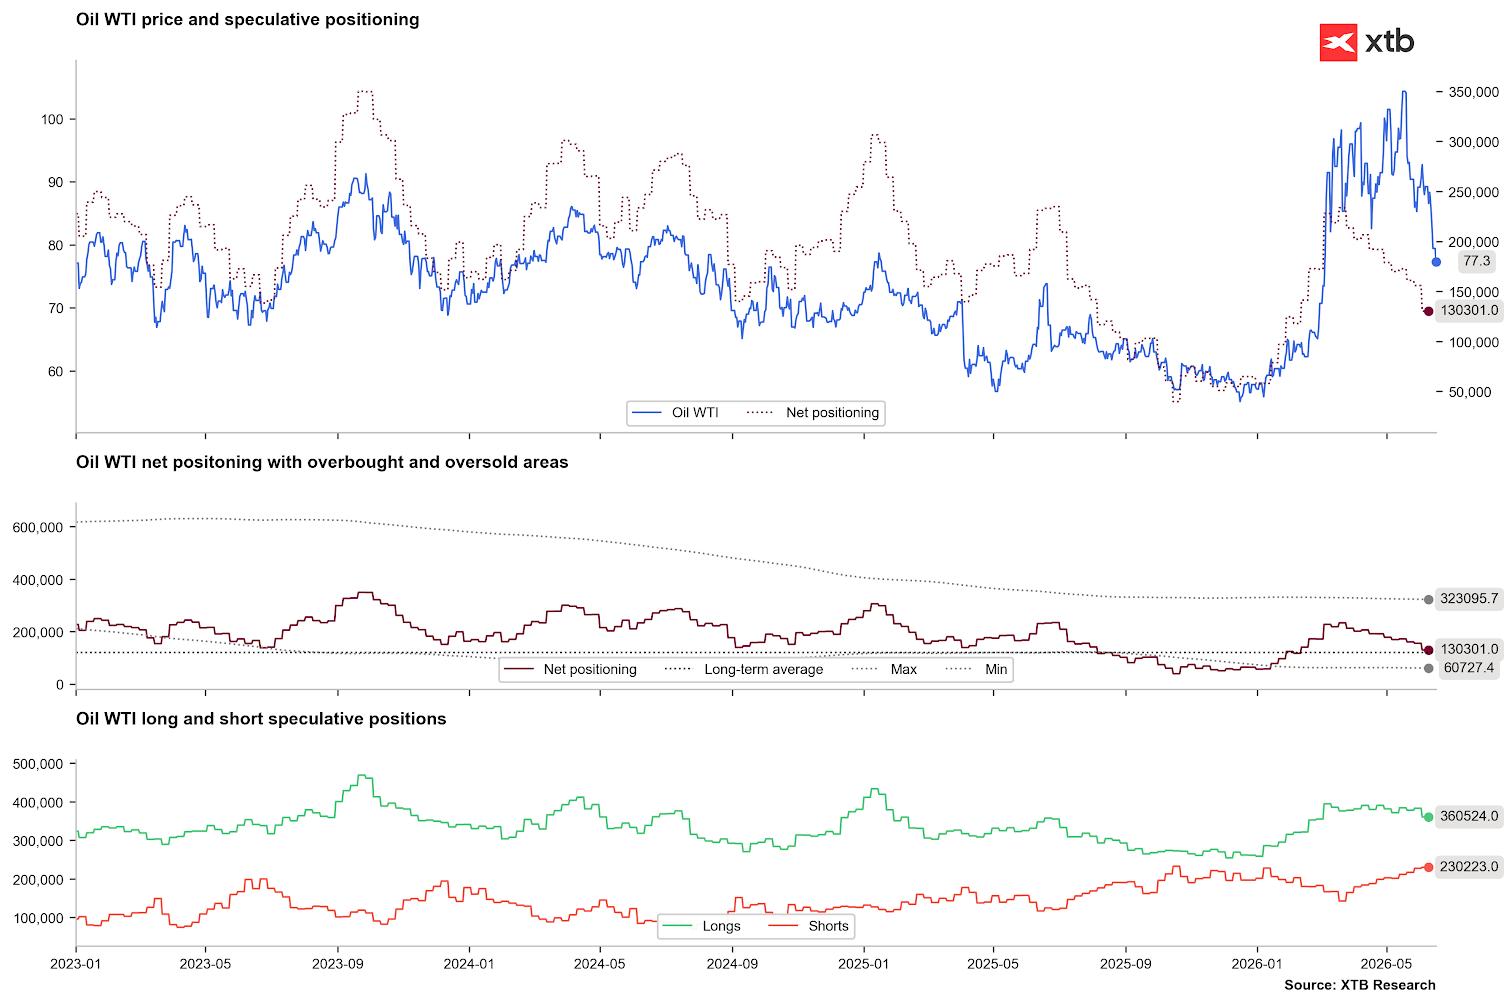
Although Open Interest in oil remains relatively low, we observe an increase in shorts in the oil market. It is worth noting that net positions have already dropped below the levels of about 150,000 long positions, which was an important support point in the 2013-2015 period. In the last quarter of 2025, we observed a drop in net positions to 50,000. Source: Bloomberg Finance LP, XTB
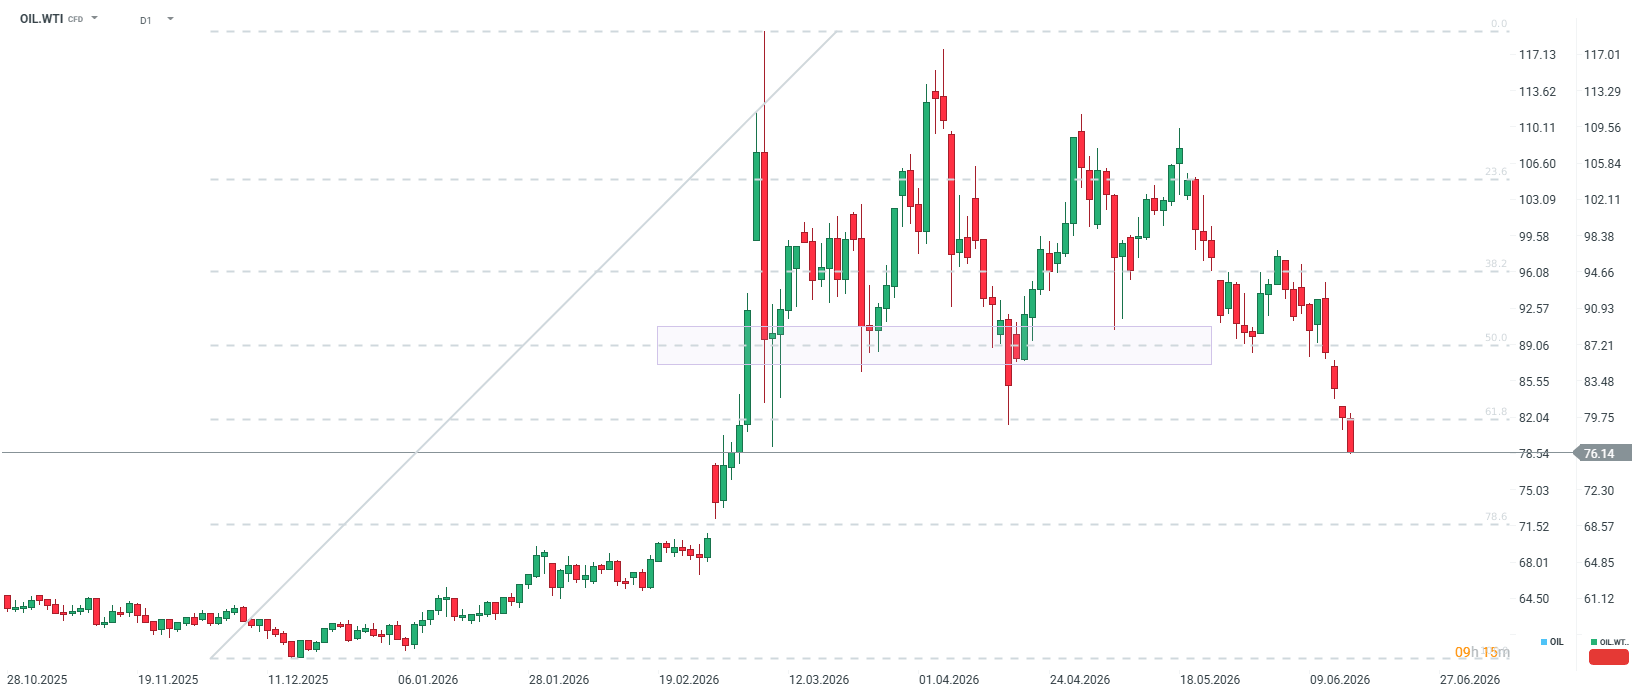
The price is 13% above the level from February 27. If the agreement is signed on June 19, it will be possible to test support around $68-70 per barrel. Taking into account many understatements, this could be an important support level at which there is a chance for a potential bounce to resistance around $80 per barrel, at the 61.8 retracement of the last upward wave. Source: xStation5 Gold
- Price rebound after sell-off: Gold quotes returned above $4340 per ounce, rising by over 3% since the beginning of the week after reports of a US-Iran agreement.
- Despite the temporary bounce, the bullion remains discounted by nearly 20% compared to the peaks from February 2026 and is slightly above the levels from the beginning of this year.
- The greatest pressure on gold price declines was caused by strong NFP data at the beginning of the month, which indicated a growing chance for interest rate hikes. On the other hand, falling oil prices could reduce inflationary pressure and decrease the chances for any interest rate hikes. After NFP, expectations indicated one rate hike by the end of this year, and currently, this probability is falling to about 60%.
- Financial markets are now awaiting the upcoming decisions of the Federal Reserve, which for the first time will be headed by the new chairman, Kevin Warsh. If he delivers a more dovish message, it may set the stage for gold price increases even to around $4500, leading to a V-shaped recovery in gold prices.
- Historic shift in central banking: According to the latest survey by the World Gold Council, as many as 45% of the 74 central banks surveyed intend to increase their gold reserves over the next 12 months.
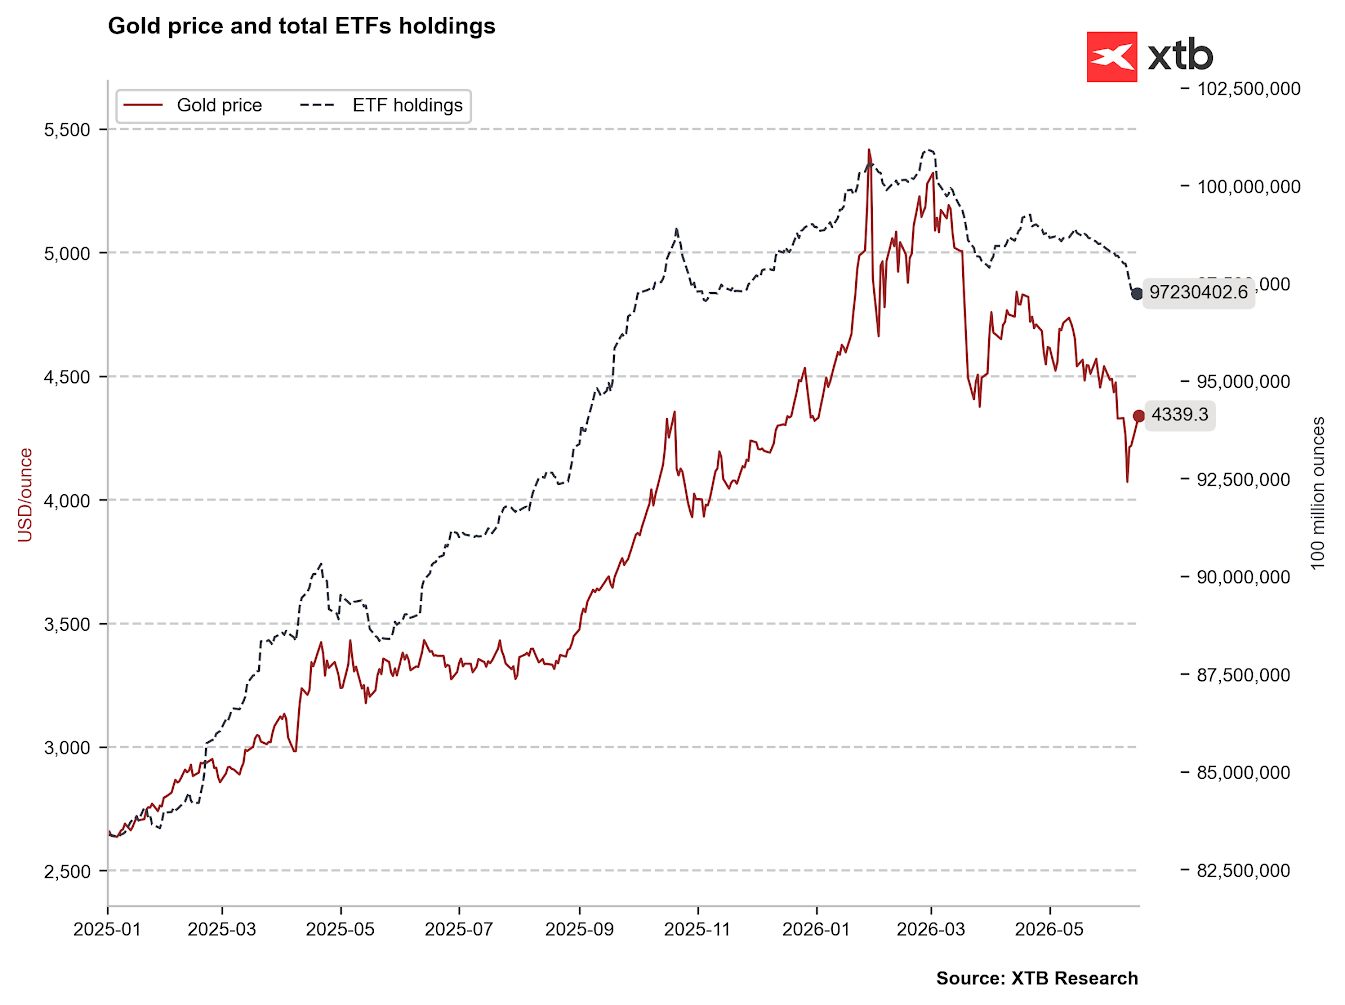
Gold is bouncing due to the decreasing probability of interest rate hikes, while ETF funds continue their sell-off, currently holding the smallest amount of gold since November 2025. Source: Bloomberg Finance LP, XTB
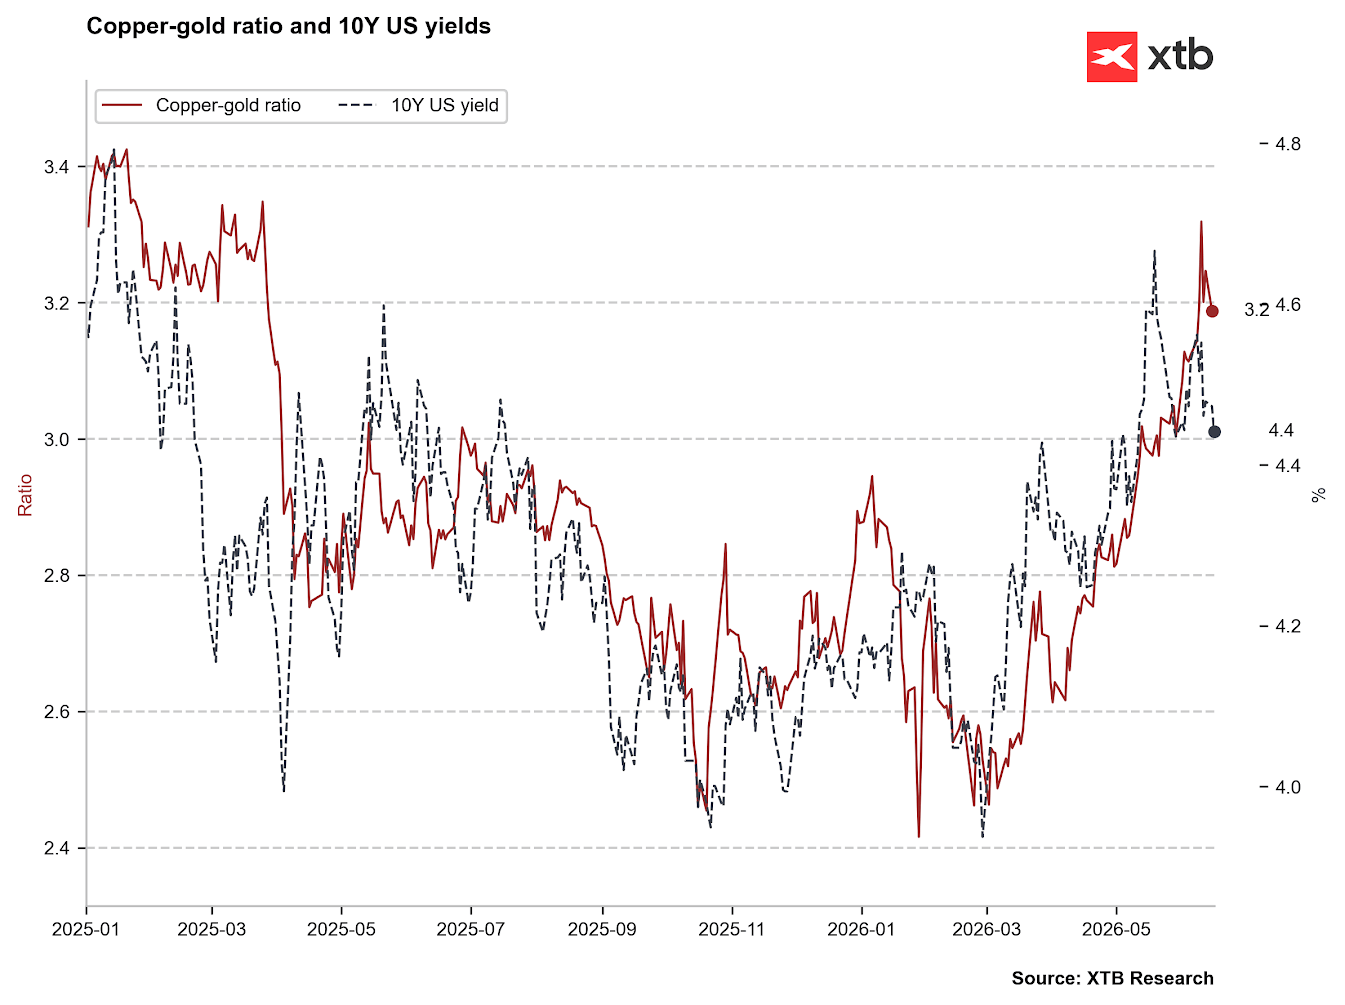
The ratio of gold to copper prices has risen to very high levels, while US yields have limited their increases, which could be an important signal for gold. Source: Bloomberg Finance LP, XTB
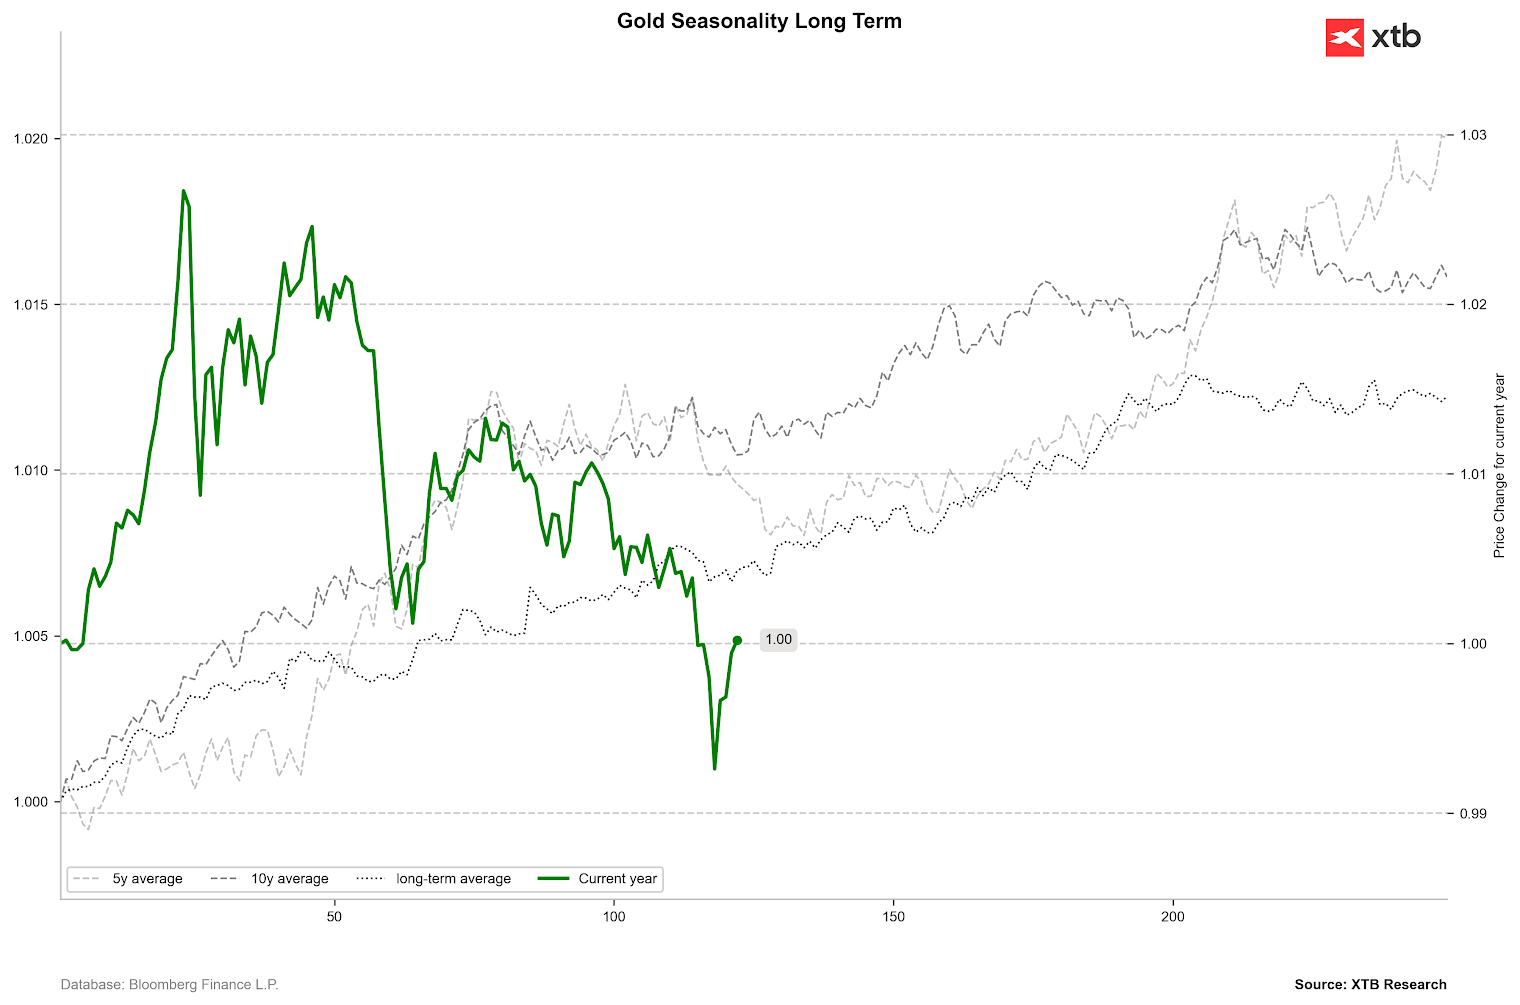
In line with seasonality, gold should now enter a period of growth after a consolidation period. Source: Bloomberg Finance LP, XTB
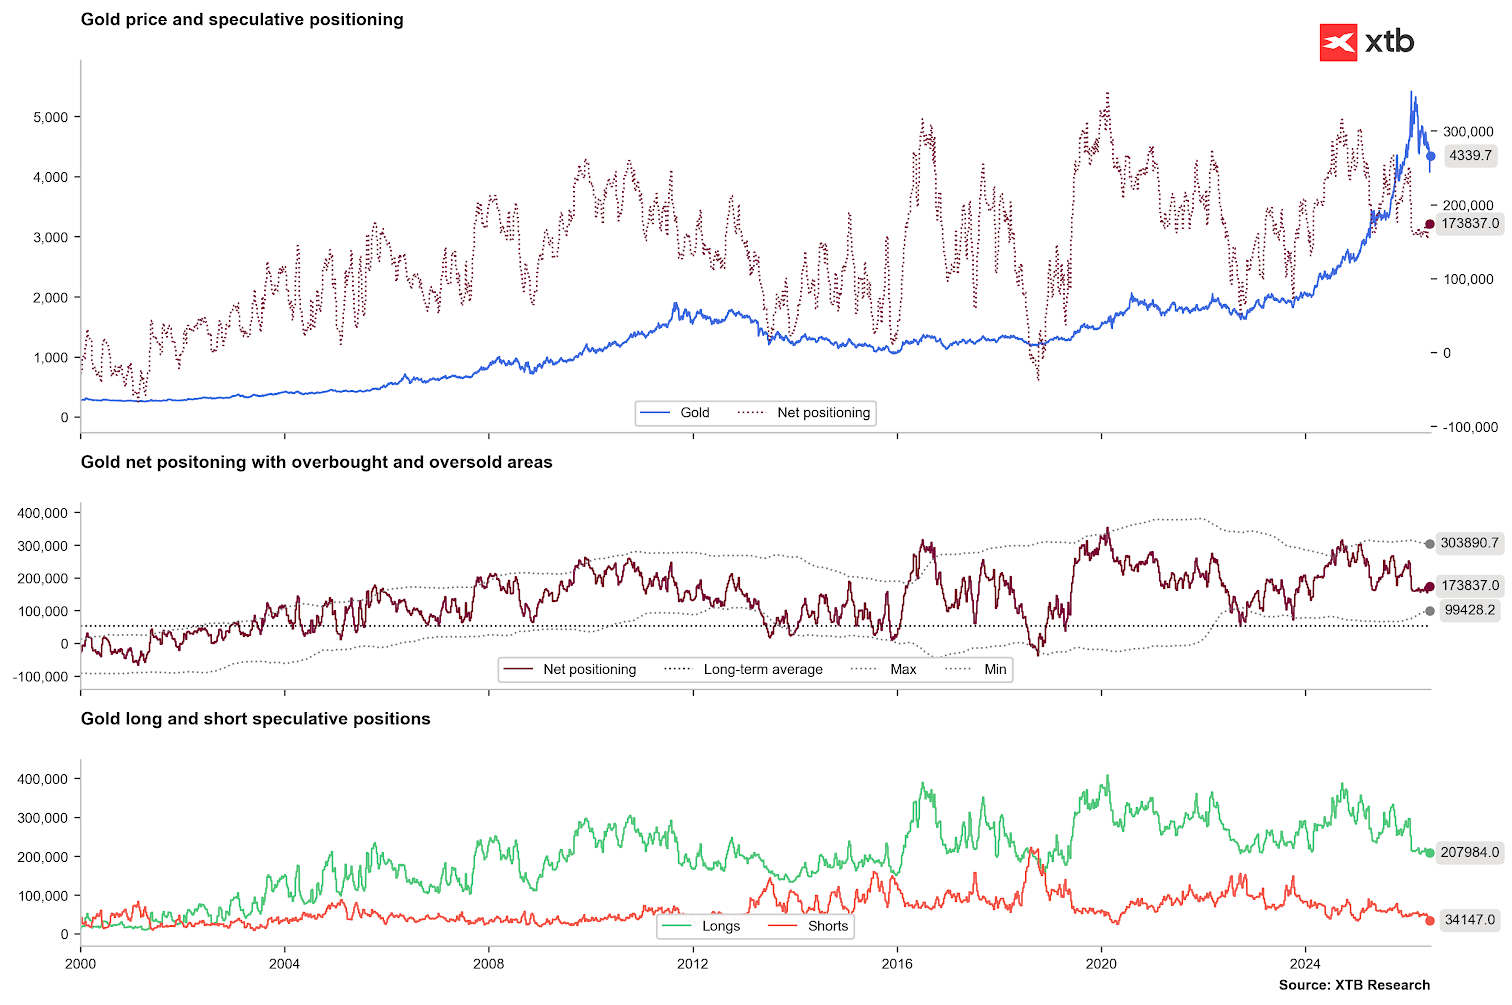
Net positions are starting to bounce, but primarily due to a reduction in short positions, which were already at extremely low levels. For now, we are not observing any major moves on the buying side. Source: Bloomberg Finance LP, XTB
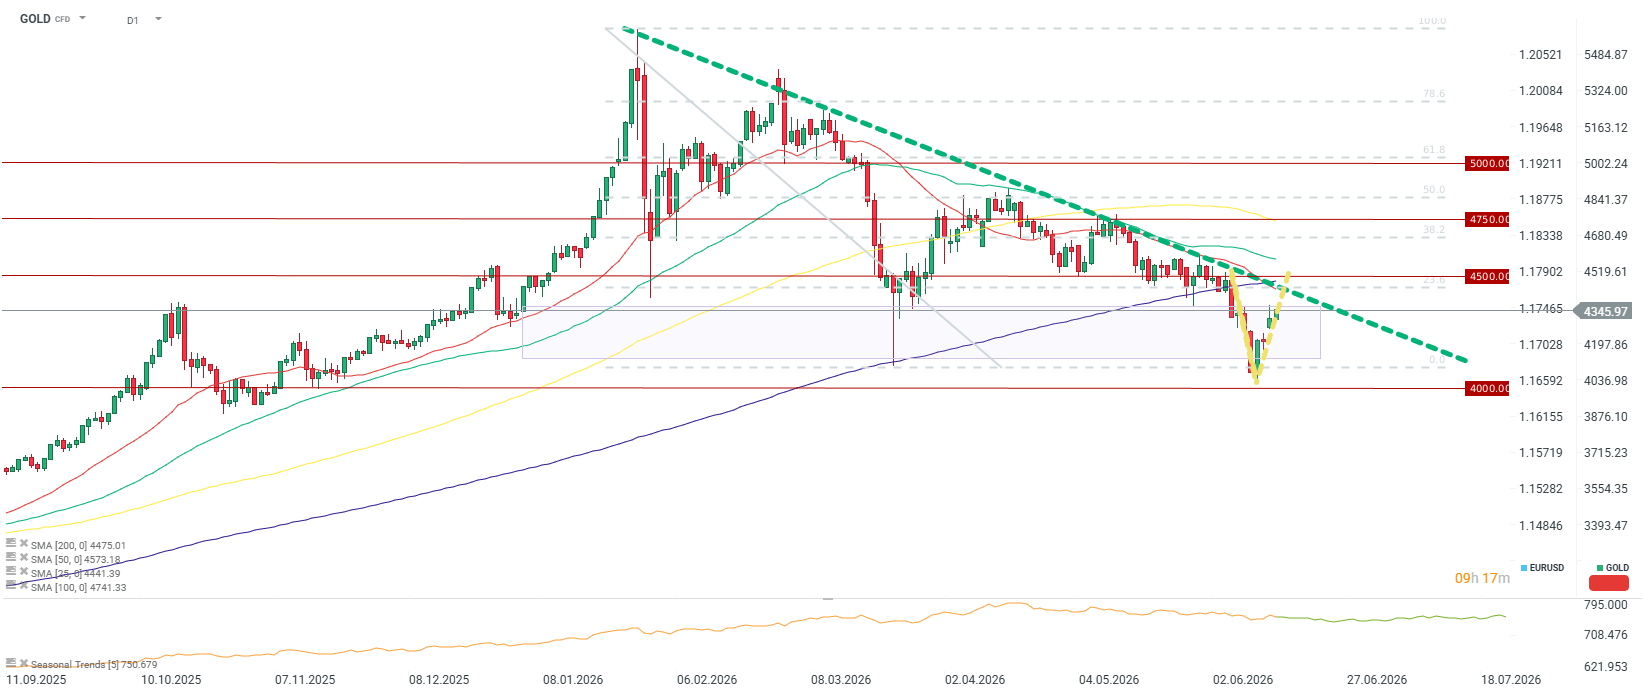
Gold may be preparing for a V-shaped bounce, which could lead to a test of the downward trend line and the 23.6 retracement along with the $4500 level. The 200-period average is also located in this area. Source: xStation5 Natgas
- Recovering losses thanks to LNG: July natural gas contracts in the USA rose on Barchart by nearly 3% after a strong slump on Thursday, when inventory data were published showing an increase of 108 bcf, above market expectations.
- Record export flows: A strong factor supporting prices is the demand generated by LNG export terminals. Estimated net flows to US export hubs increased by 11.9% week-on-week, reaching 19.1 bcf per day.
- Supply-weather balance: According to BNEF estimates, domestic gas production in the US settled at 111.7 bcf/day (+4.2% y/y), while current demand is 75.9 bcf/day (+9.1% y/y).
- A chance for gas in the context of the approaching summer period is El Nino, which will raise temperatures in the USA, but on the other hand, it may also cause a warmer winter.
- End of negative prices in Permian: Producers operating in the world’s largest shale basin (Permian) recorded positive prices for the natural gas they produced for the first time in over four months, ending a long period of negative spot rates. It is worth emphasizing that negative prices are related to gas extraction alongside crude oil and due to logistical problems.
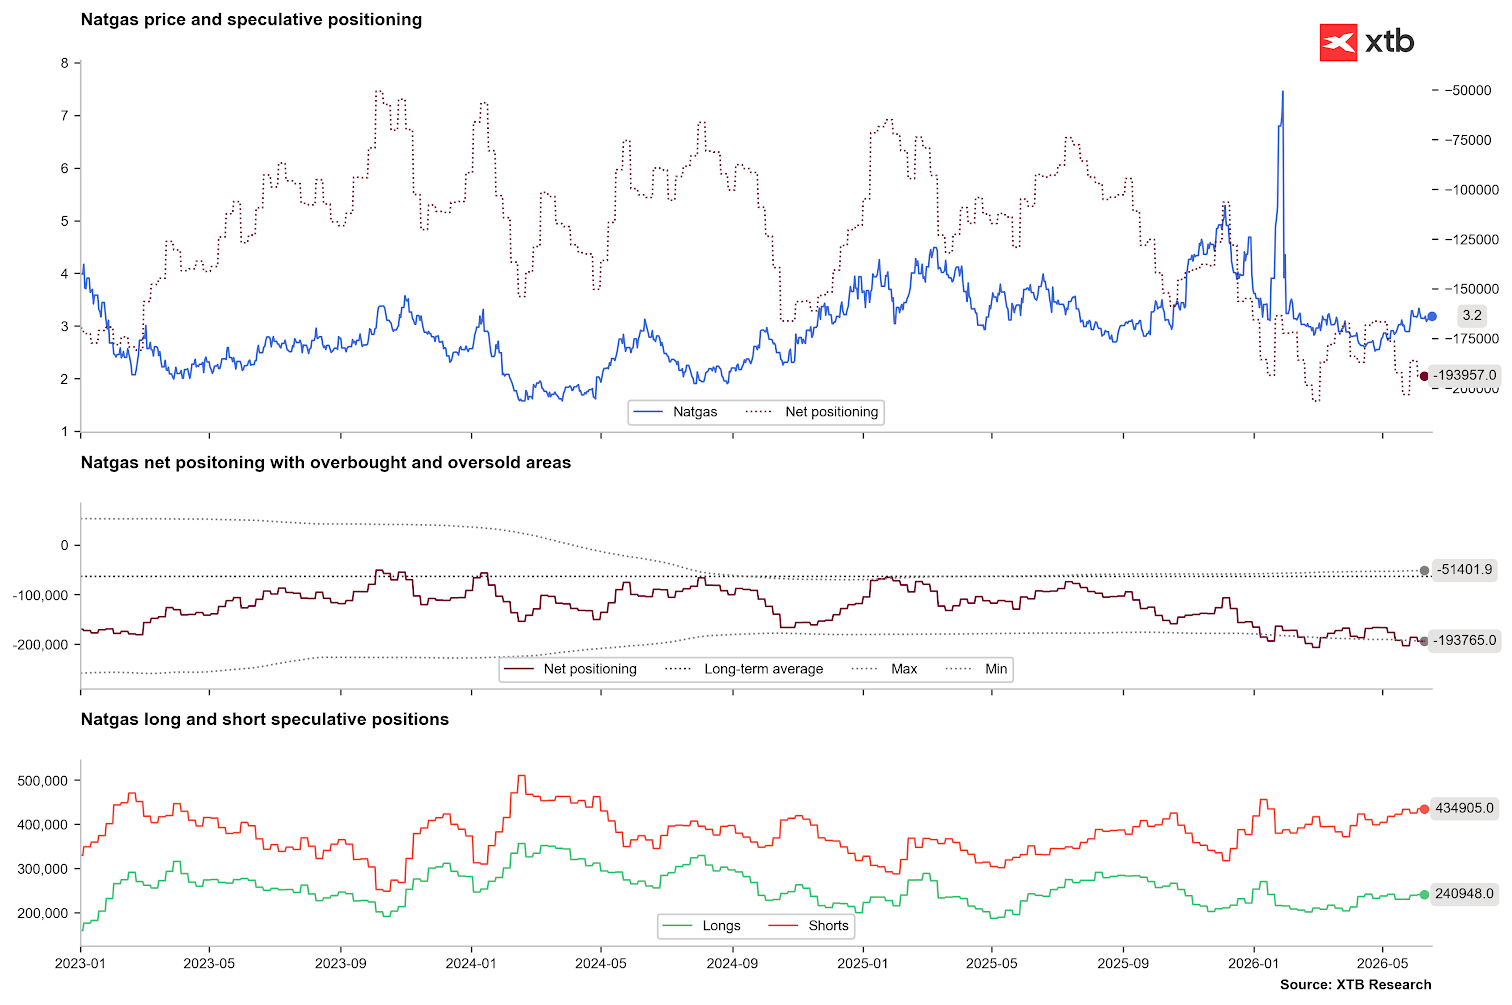
Short positions are rising, which may indicate the approaching end of the upward pressure. On the other hand, the number of short positions is approaching extremely high levels, looking from the perspective of the last 2 years. Source: Bloomberg Finance LP, XTB
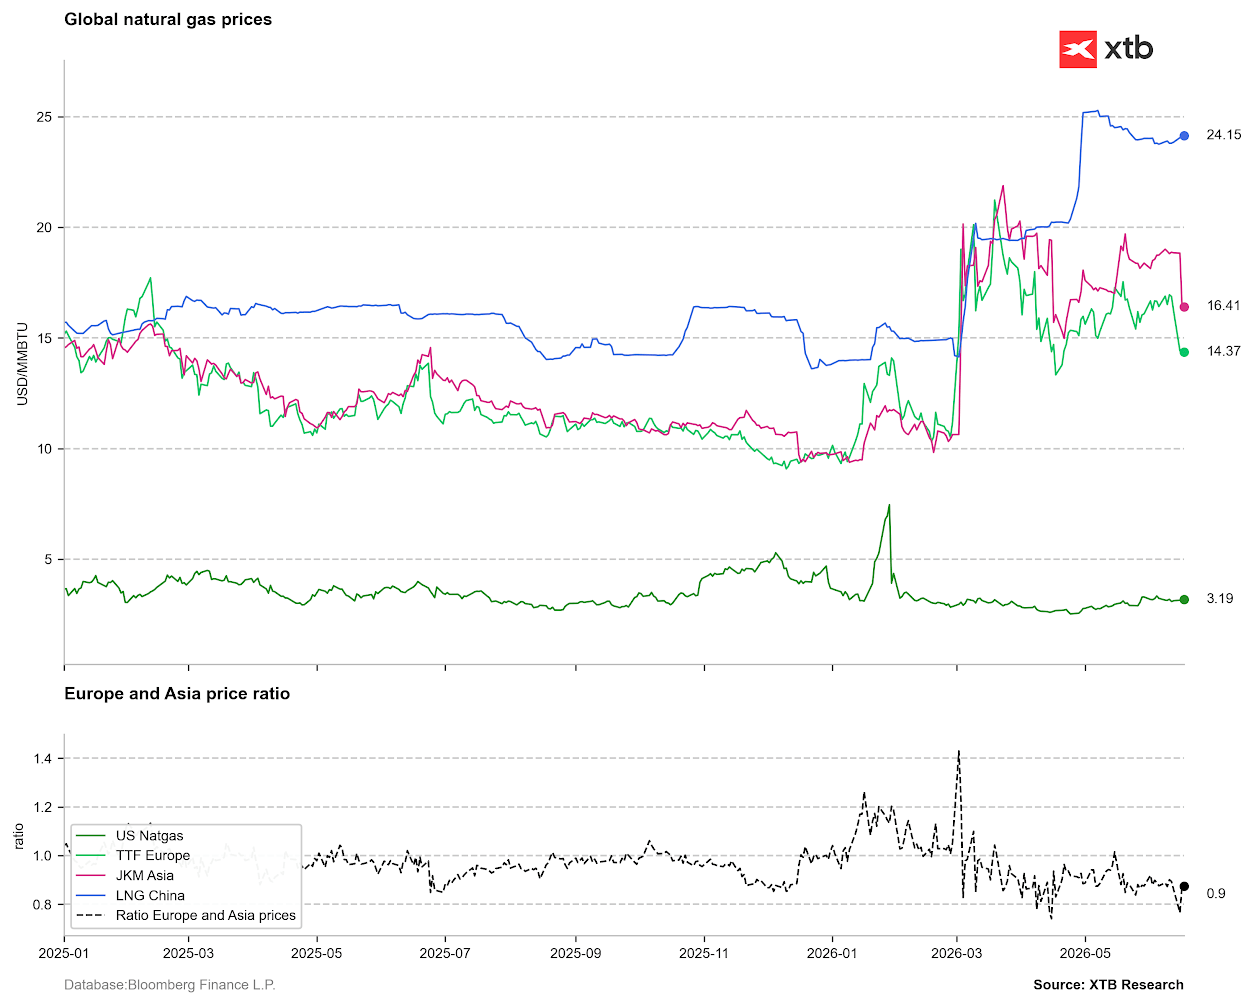
The potential for ending the war in the Middle East clearly affects the market quotes for LNG gas prices in Asia and Europe. Source: Bloomberg Finance LP, XTB
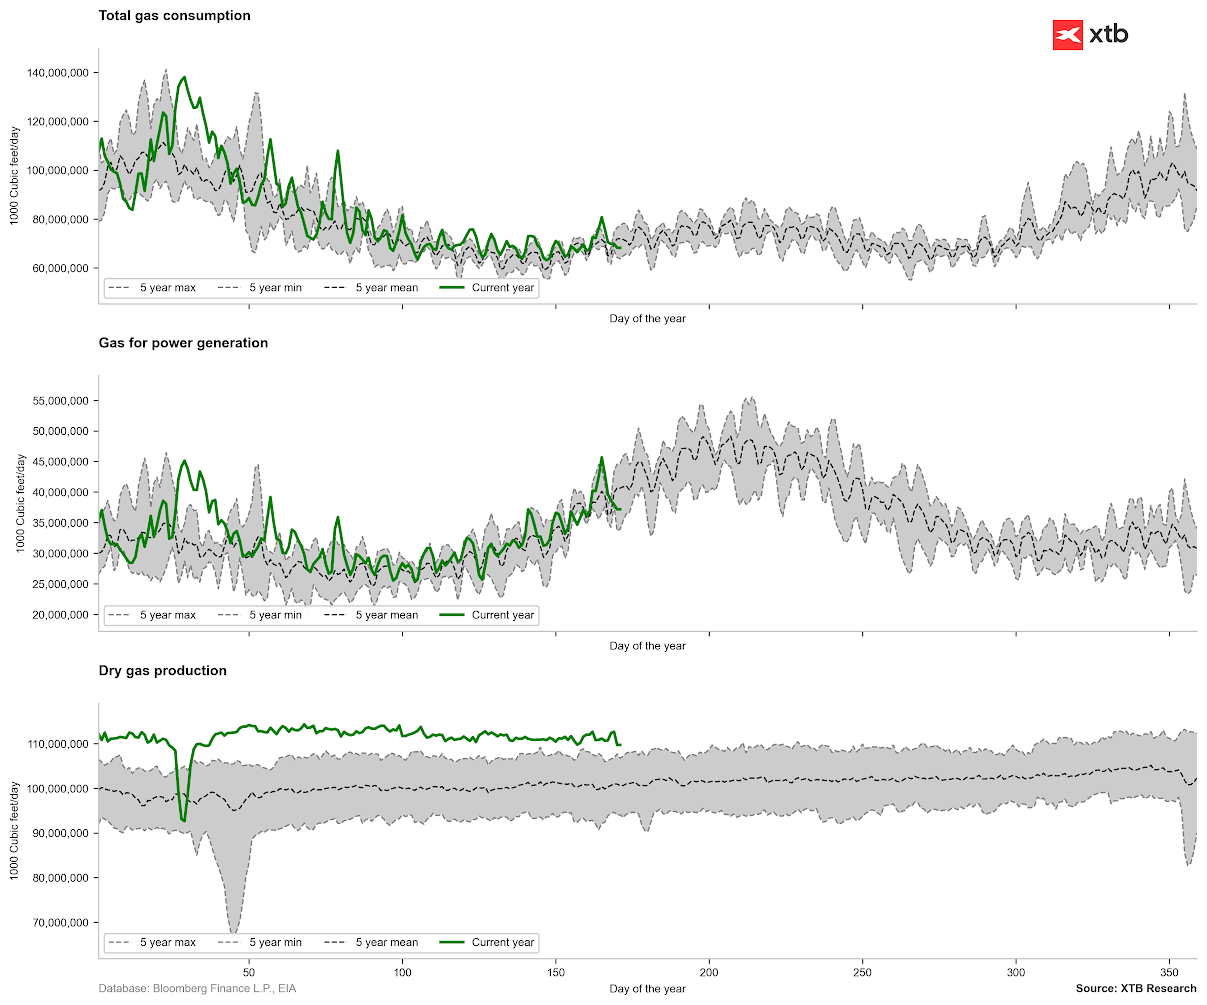
Gas demand is currently falling below the 5-year average, which may exert short-term pressure on gas. At the same time, the trend indicates a further increase in gas utilization by power plants, at least from the perspective of the next 2 months. Source: Bloomberg Finance LP, XTB
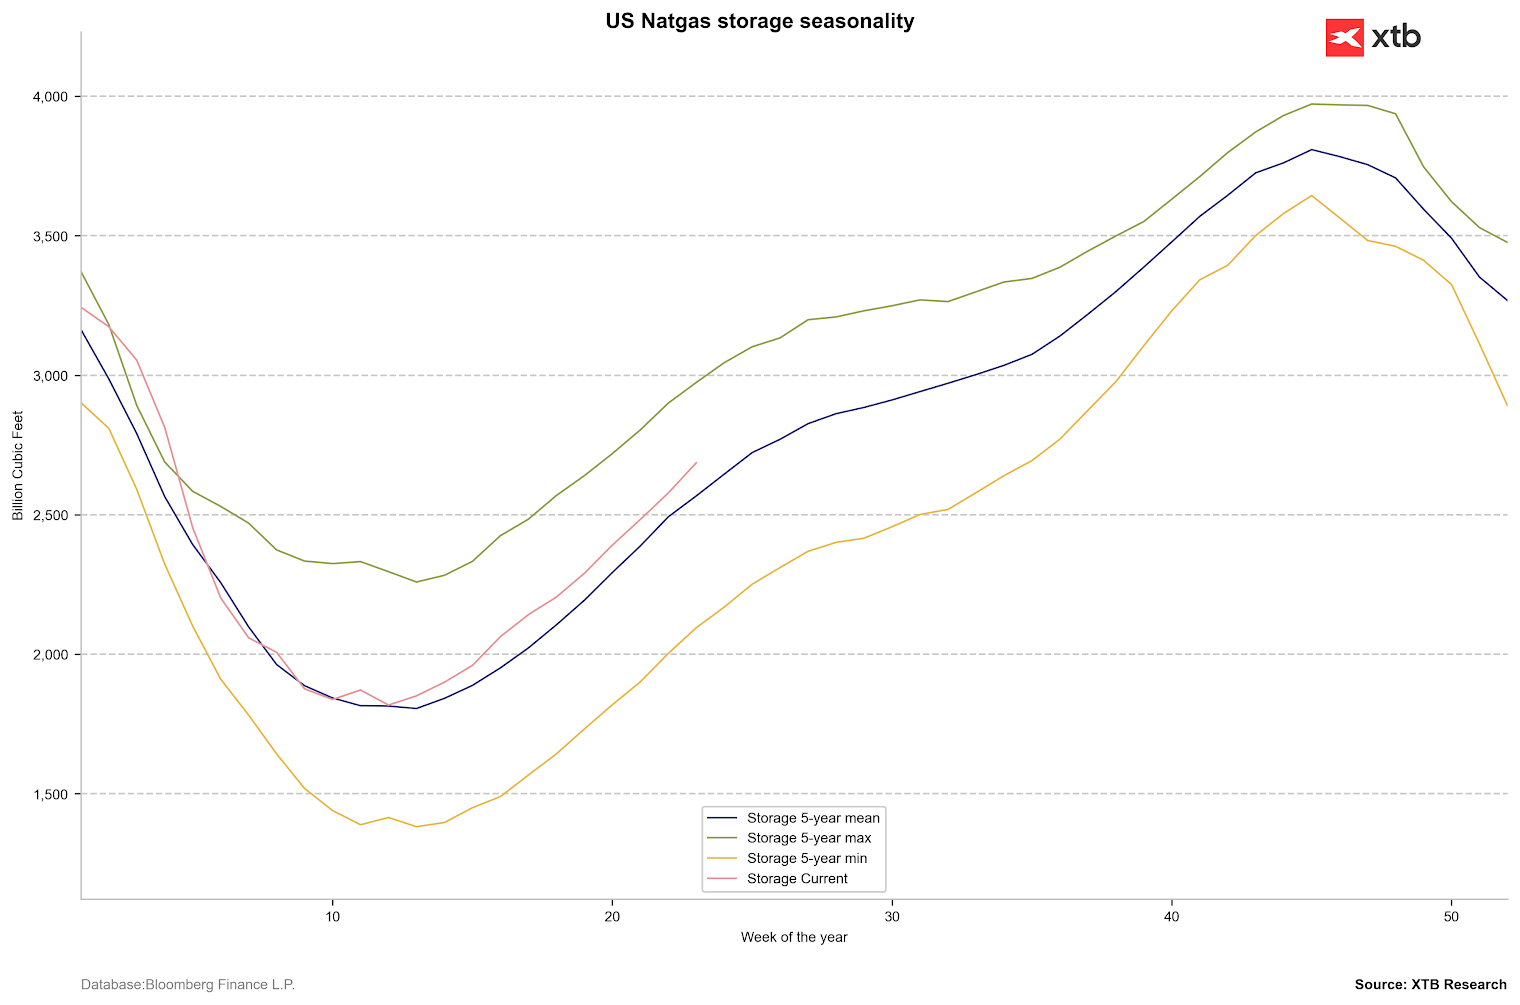
Gas inventories increased slightly above the 5-year average, but we should now prepare for a period of smaller inventory increases. If this does not happen, however, the price may dive below $3/MMBTU again. Source: Bloomberg Finance LP, XTB
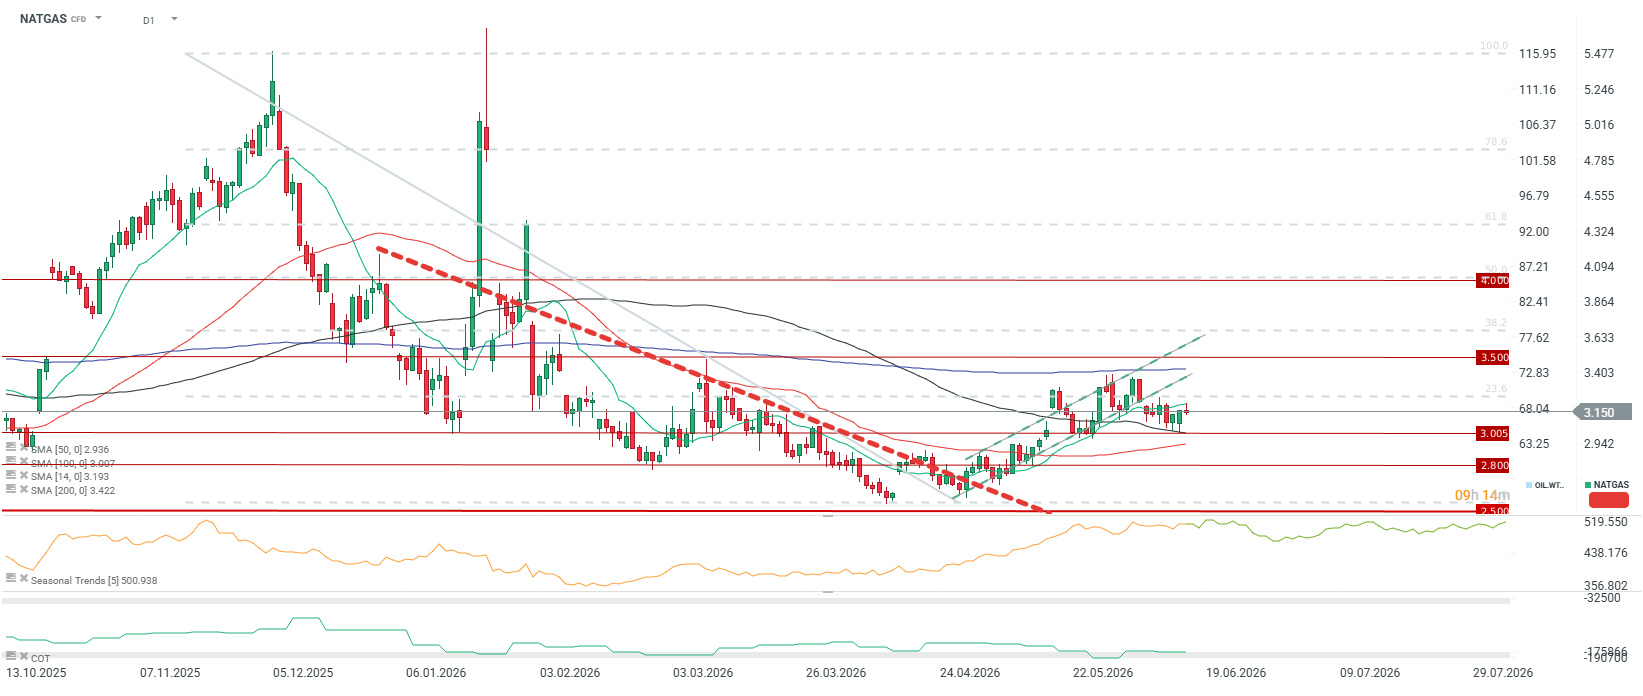
The gas price is trying to bounce after last week’s declines. Support is maintained at the 100-period average, but on the other hand, the price remains below the 14-period average, which is key to maintaining the upward trend. Source: xStation5 Cocoa
- Commodity broker Marex estimates that the current season will end with a global supply surplus of as much as 400,000 tons, which would be the largest surplus since the 1980s.
- Pressure on prices in West Africa: Prices on the New York Stock Exchange have fallen by nearly half since the beginning of the current season, oscillating around $4000 per ton.
- Systemic changes in Ghana: In the face of a price collapse, Ghana (the world’s second-largest producer) has begun the process of lifting rigid state price controls and plans to introduce a flexible system for automatic modification of domestic prices depending on international rates.
- Situation in Brazil: Local farmers are currently selling beans at a record discount of approximately $1000 per ton relative to the New York Stock Exchange. This is interesting because cocoa from South America is considered to be of higher quality than from African countries. Analysts at StoneX, however, expect this discount to narrow as processors resume intensive grinding of beans, encouraged by the return of global prices to higher levels.
- Diversified weather and El Nio risk: Communiques from Africa indicate good weather conditions and progressing mid-crop harvests in Ivory Coast and Ghana. On the other hand, in Cameroon, heavy rains are destroying flowers and cutting off access to plantations, and in Nigeria, excess rainfall has triggered an outbreak of a dangerous disease (black pod). Bloomberg Intelligence warns that the strengthening El Nio phenomenon carries the risk of drought in West Africa, and the observed low state of fruit set (cherelle) threatens harvests in the 2026/27 season.
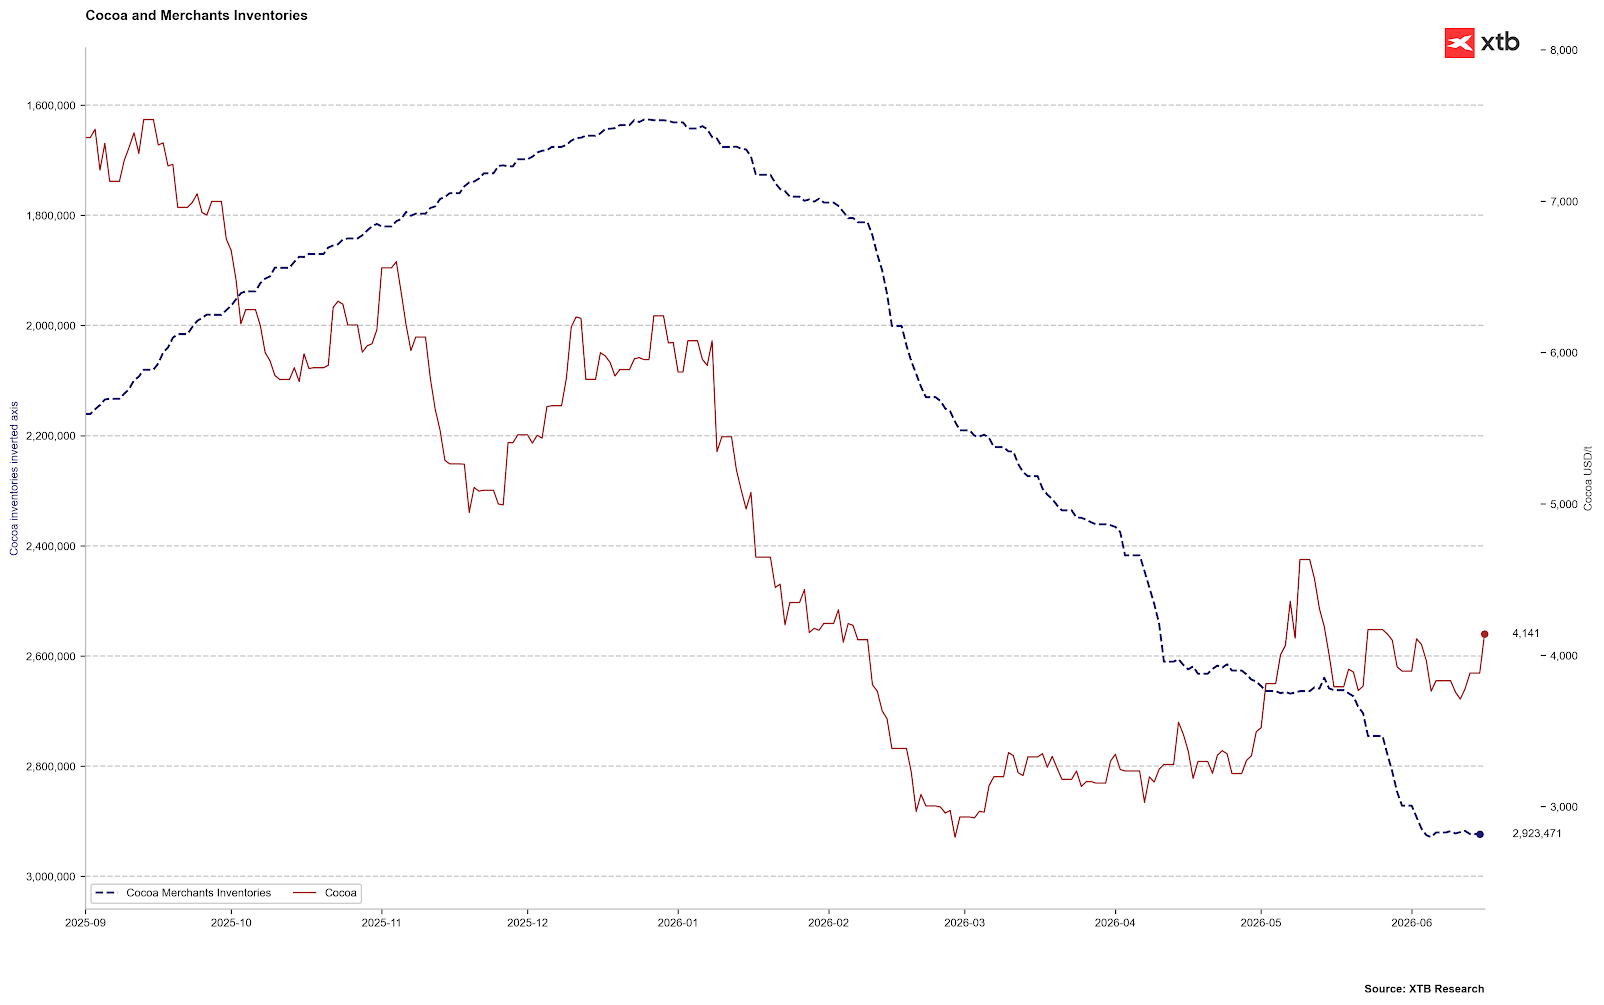
Cocoa inventories have stopped growing (inverted axis), which is a normal situation for this time of year. If, however, it turns out that they return to growth in the coming months, it will be a sign of actually the largest oversupply in decades. Source: Bloomberg Finance LP, XTB
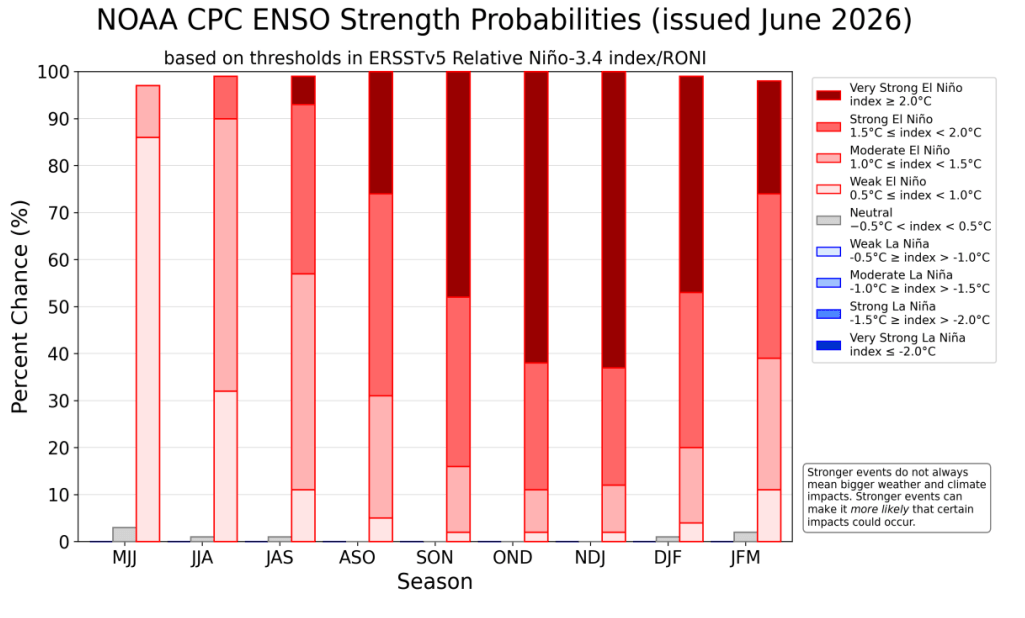
NOAA’s forecast indicates a more than 60% probability of a very strong El Nio occurring in the October-January period. This is the period when we have to deal with the beginning of the main season in West Africa. Source: NOAA
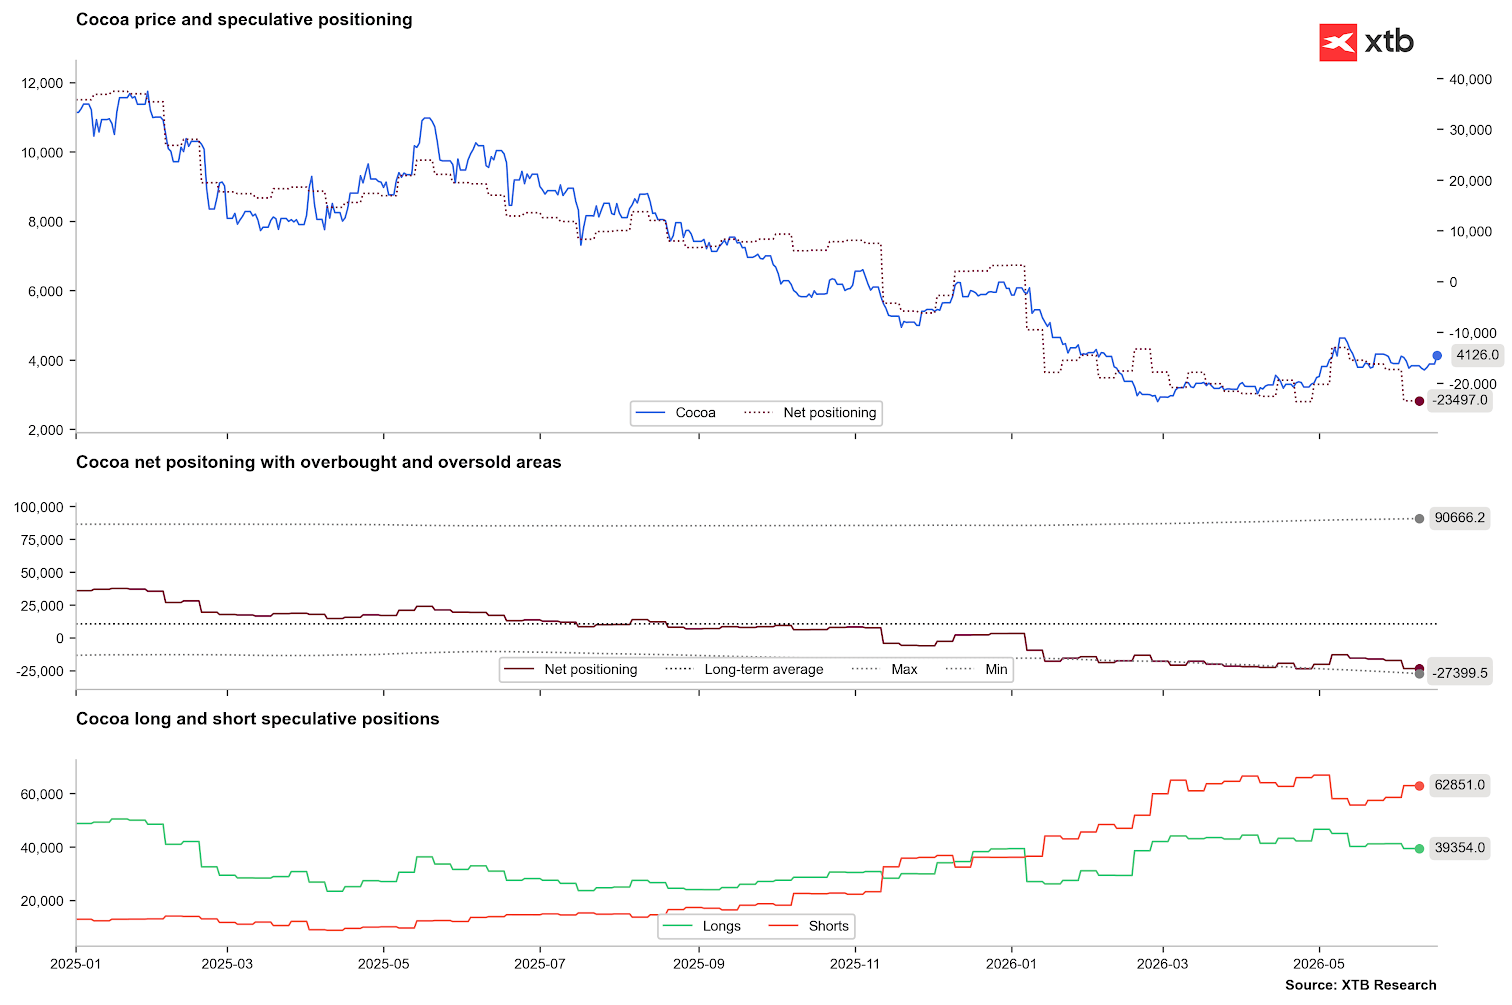
In recent weeks, there has been a clear reduction in short positions, which occurred in early May. On the other hand, we are currently observing the rebuilding of the short side, which may testify to the lack of sustainability of the current recovery. It is worth remembering, however, that in the background we have the approaching El Nio, which may significantly shuffle the market in the autumn period. Source: Bloomberg Finance LP, XTB
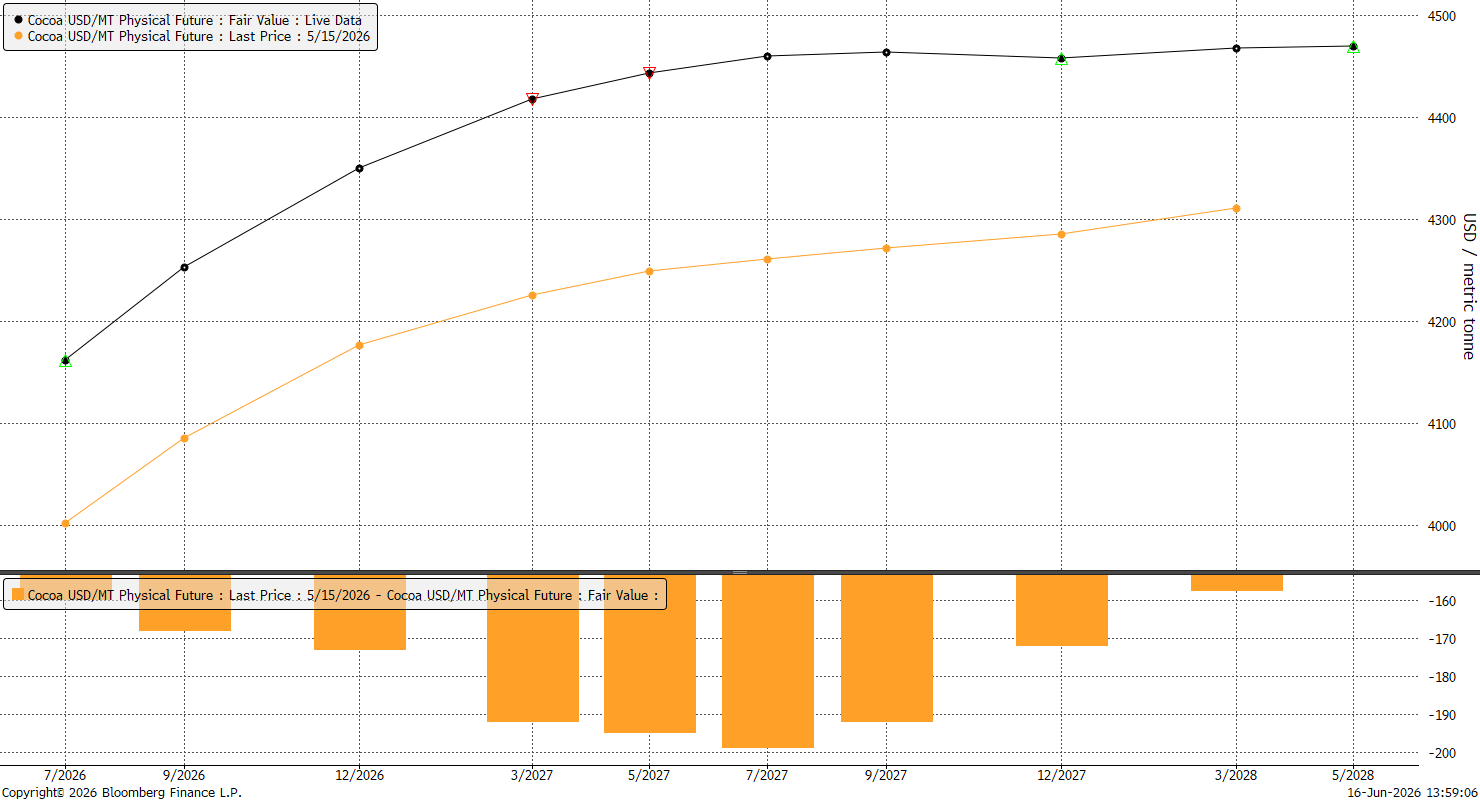
The forward curve in a year’s perspective is in contango, but later the curve is already clearly flat, which may indicate that the market is slowly preparing for a change in fundamentals. The March 2027 contract looks most interesting from the perspective of a possible bounce, its difference from the highest-quoted contract on the curve is minimal. On the other hand, the current contango is also not extremely large, as the difference between the current July contract and the July 2027 contract is about $300. Source: Bloomberg Finance LP, XTB
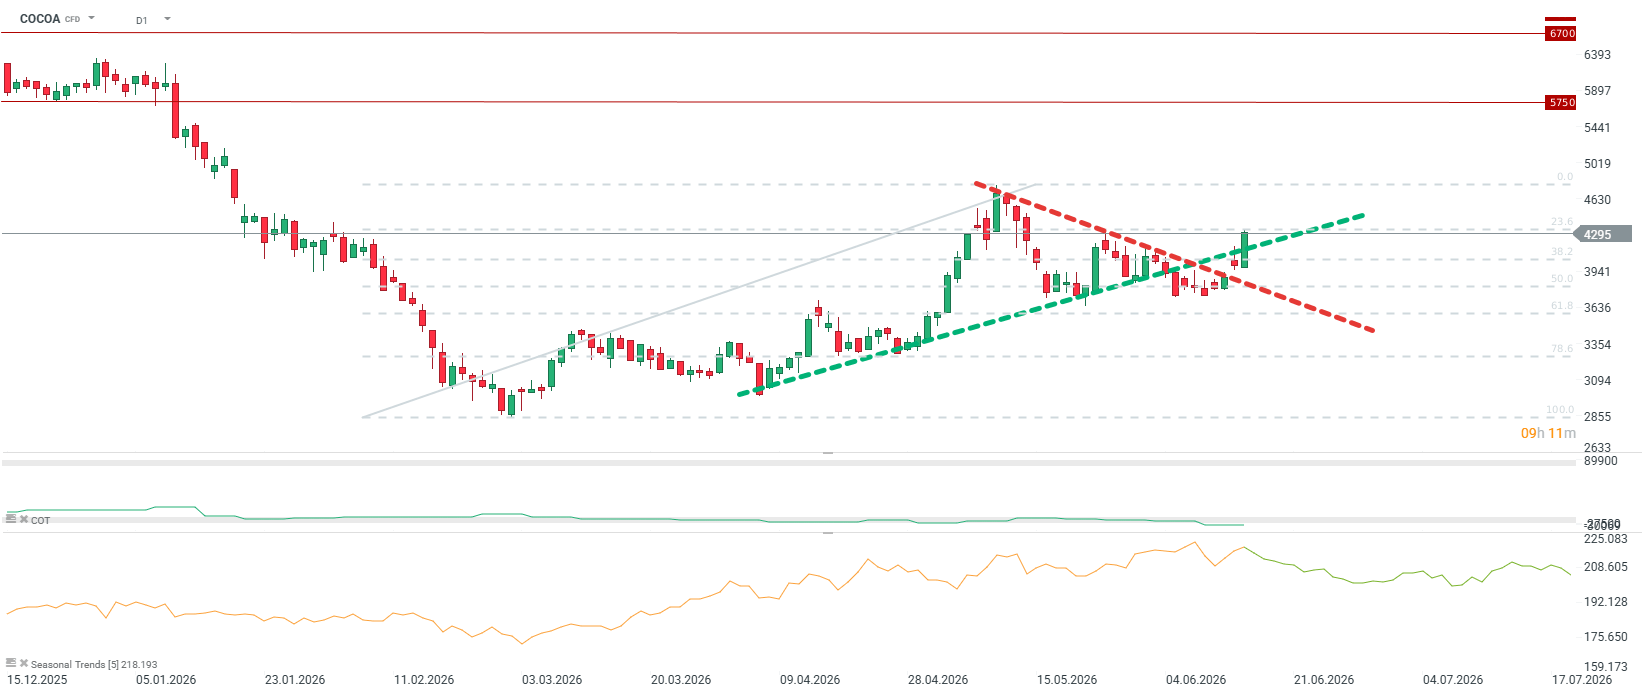
Cocoa is breaking out of the downward trend and returning to an upward trend. An important level of $4300 is being tested. The increases are related to fears about El Nio, but there has been no actual change in fundamentals, which may lead to clear volatility in the near future. The eventual impact of El Nio may be visible only in a later period. Source: xStation5