
Key takeaways
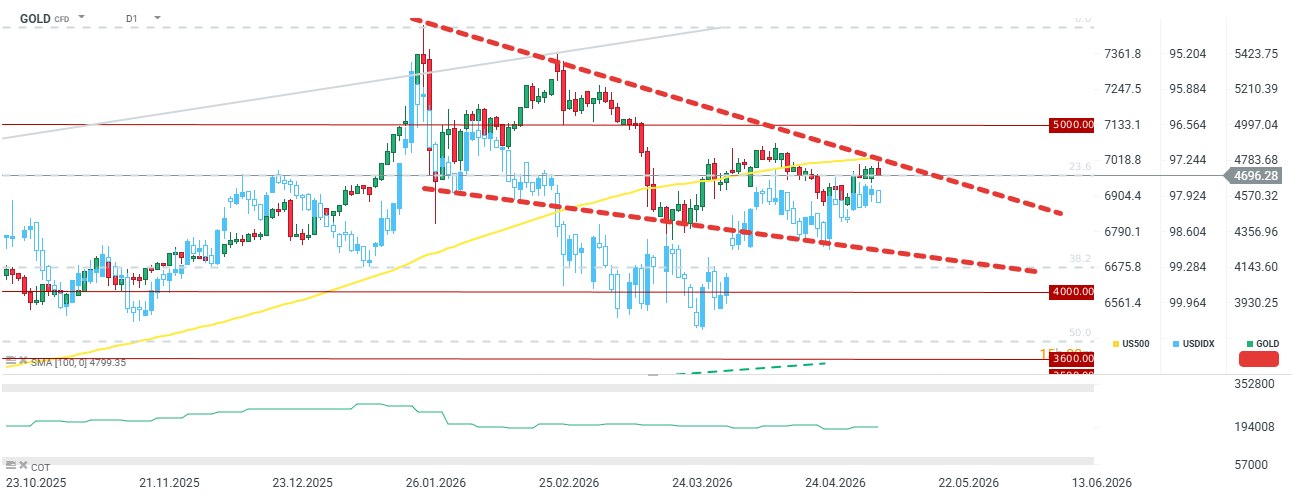
- Gold is dropping below $4,700 per ounce
- The key macro report for the gold and the dollar is the US CPI release
- Recent data from the World Gold Council for the Q1 2026 was supporting for the gold but with some minor drawbacks
Gold prices are shedding approximately 0.5% during Tuesday’s session, following several days of stagnation and a failure to decisively break above the $4,700 per ounce level. Notably, the price remains below the 100-period moving average and the downward trendline. We are observing a slightly stronger dollar today, driven not only by expectations of higher inflation but also by the geopolitical impasse in the Middle East. Reports suggest Trump is considering a resumption of hostilities in Iran following the rejection of the latest peace plan. Today’s CPI inflation is expected to rise to 3.7% y/y, while core inflation is projected to reach 2.7% y/y.
If inflation proves to be “sticky,” pressure on the central bank will mount, which could weigh on precious metals in the near term. On the other hand, it is worth noting that silver broke out of its resistance zone yesterday, accompanied by a sharp rebound in copper prices. The fundamental outlook for gold remains solid: demand is being driven by central bank purchases and retail investors buying physical gold. However, ETF demand saw a significant drop in Q1, and we have yet to see a meaningful recovery, even with Wall Street hitting record highs. Gold requires a clear improvement in the Middle East situation and certainty that inflation is merely transitory and will not trigger a fresh wave of interest rate hikes.
Key Data: World Gold Council Report
- Total demand (including OTC): Total gold demand increased by 2% y/y to 1,230 tonnes. Conversely, excluding OTC, there was a decrease of 9% y/y and 10% q/q.
- Record central bank purchases: Central banks purchased 243 tonnes of gold.
- Jewelry consumption: Jewelry demand fell sharply by nearly 1/4 on both a yearly and quarterly basis, dropping to 335 tonnes.
- Gold supply: Total supply increased minimally year-on-year, reaching 1,230 tonnes; however, this represents a significant decline compared to the previous two quarters, which may suggest a potential ongoing deficit.