Global Markets
S&P 500 — US Large Cap Index
NASDAQ 100 — Tech Growth Index
Dow Jones — Industrial Average
FTSE 100 — UK Blue Chips
Euro Stoxx 50 — Eurozone Leaders
DAX 40 — German Equities
CAC 40 — French Market Index
Nikkei 225 — Japan Benchmark
Hang Seng — Hong Kong Index
Shanghai Composite — China Mainland
ASX 200 — Australian Market
TSX Composite — Canada Index
Nifty 50 — India Large Cap
STI Index — Singapore Market
KOSPI — South Korea Index
Bovespa — Brazil Equities
JSE Top 40 — South Africa Index
IPC Index — Mexico Market
EuroMarketsTechnical AnalysisUSD

Technical Analysis – EUR/USD

Since mid-April, the EUR/USD pair has been trending downward. Recently, new lows were set and the March lows were broken, confirming the dominance of the supply side. We are currently observing a local upward correction. The price is approaching a key short-term resistance level at 1.1430, where, among other things, the lows from mid-March of this year are located.

This is the first zone where increased selling activity may emerge. If the 1.1430 level were to be broken through on a sustained basis, the next significant resistance level would be around 1.1466, where the upper boundary of the 1:1 geometry and the 100-period moving average—marked in blue on the chart—are located. A bounce off both the 1.1430 and 1.1466 levels could trigger another downward wave.

Only a sustained break above the 1.1466 zone could invalidate the current setup and increase the chances of a larger upward correction. For now, however, the base case scenario remains a continuation of the downtrend.

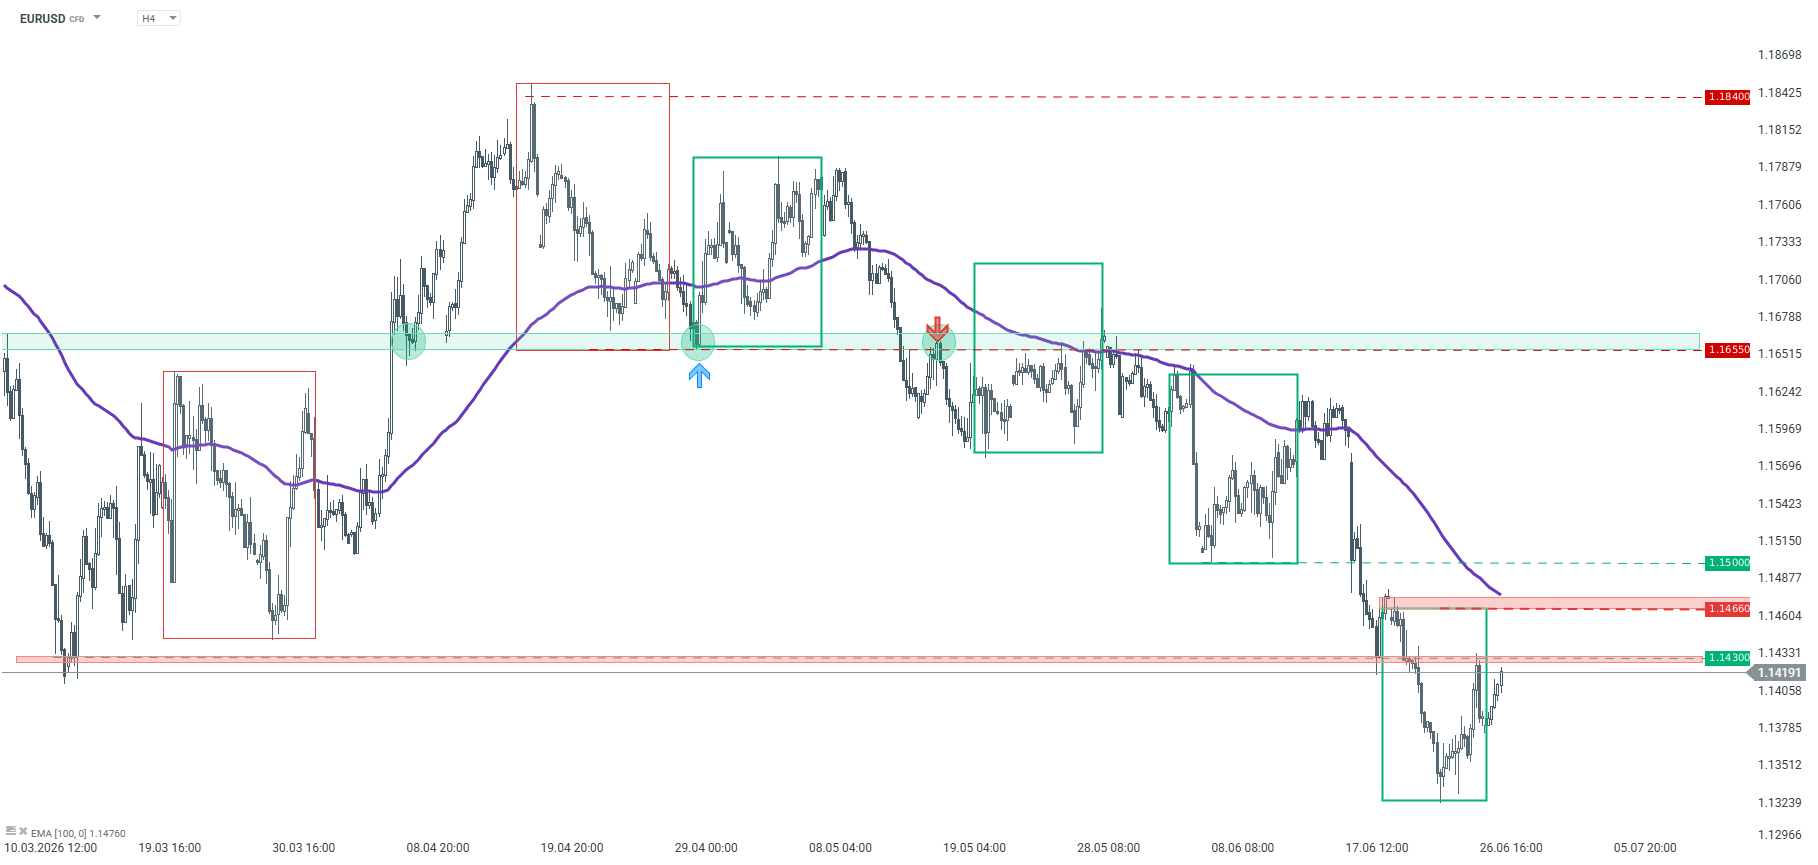
EURUSD – H4 timeframe. Source: xStation5

Octalas AI
Octalas Logo

Profit

Everyone's racing to cut costs. We're racing to create profit.

Start Selling through Service

Free for 14 days · No credit card required
Profit Through AI

Related Articles

Leave a Reply

Your email address will not be published. Required fields are marked *

Back to top button