Chart of The Day – SILVER doesn’t give up – Capital flows back to the market
SILVER continues its rebound (+2.1%), recovering from yesterday’s late-session pullback and re-testing psychological resistance at $80 per ounce . Precious metals are maintaining their upward trend despite the military incident in the Strait of Hormuz, as a resurgence in speculative demand supports the ongoing rebound.
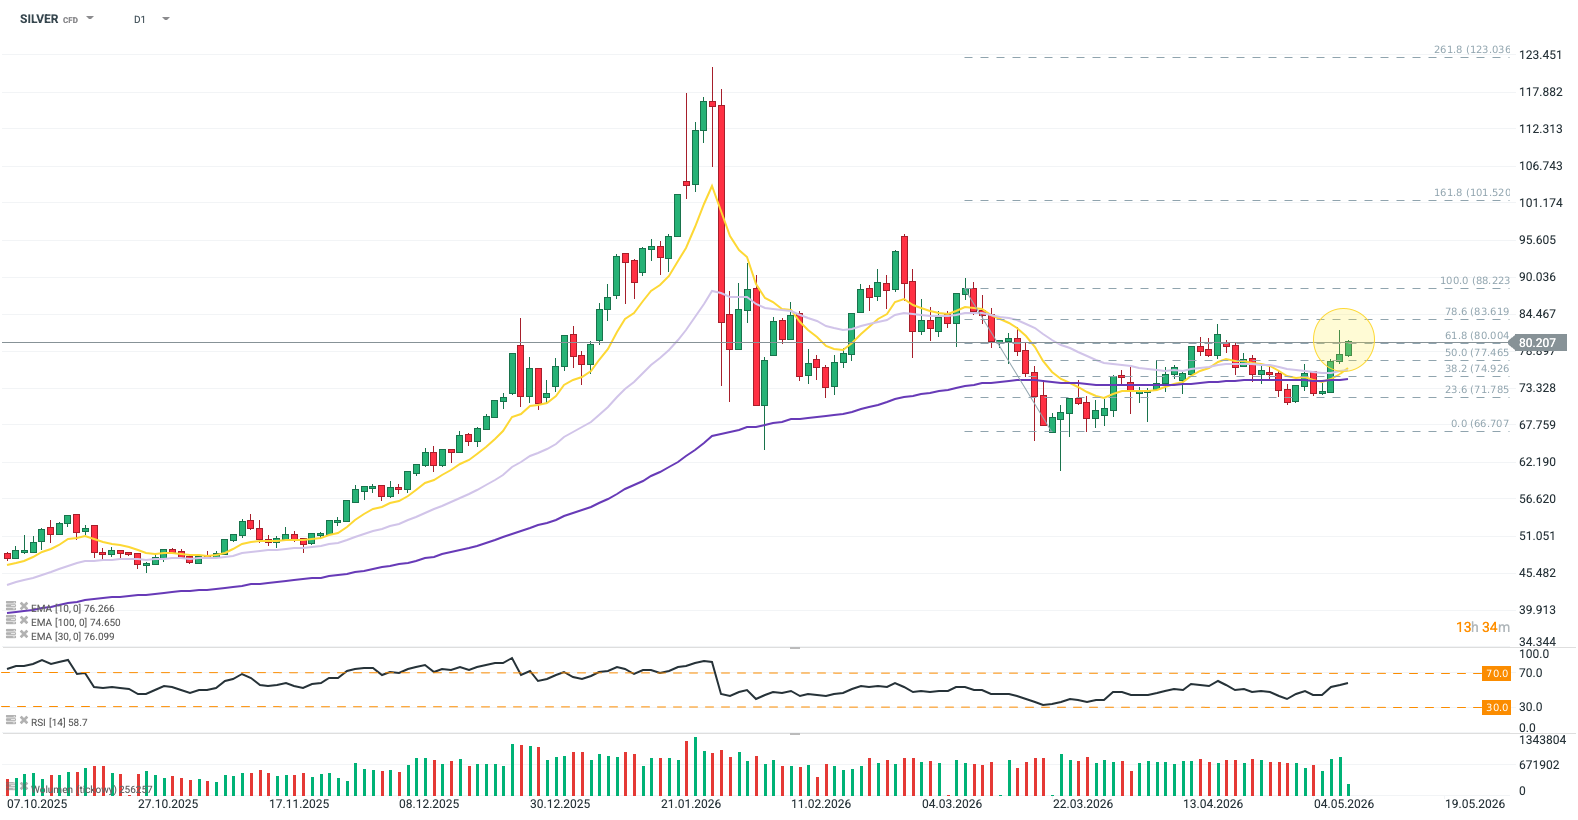
The SILVER contract has recouped approximately half of yesterday’s closing “dip.” Breaking above three key Exponential Moving Averages (EMA10, EMA30, and EMA100) provides a clear signal of bullish momentum. However, unless the price secures a breakthrough above $80, further consolidation around these averages remains more likely than a sustained breakout. Source: xStation5 What is driving SILVER today?
- Dollar Weakness: Market pricing in de-escalation. The Dollar Index ( USDIDX ) has spent several sessions testing key support near 97.50–97.80 (approx. 2-month lows). The return to levels seen before the conflict with Iran suggests the market is aggressively pricing in a peace scenario and stripping out the geopolitical risk premium. Additionally, US 10-year yields remain 10 bps below their April peaks , enhancing the relative appeal of non-yielding assets.
- Geopolitical Apathy: Strait of Hormuz ignored . Despite a firefight involving US destroyers, silver quickly resumed its rally. This return to pre-incident trends (weaker dollar, falling oil, stable yields) proves investors view regional tensions as transitory “noise,” preferring to focus on optimism surrounding the proposed one-page peace agreement.
- Silver Accumulation: Return of “hot money.” CME Group data confirms that trading volumes for silver futures and options are rebounding from monthly lows, signaling a return of speculative demand. Reclaiming neutral activity levels while defending a technical bounce suggests capital has stopped fleeing the market and is now positioning for a potential breakout, treating recent dips as an opportunity to build long positions.
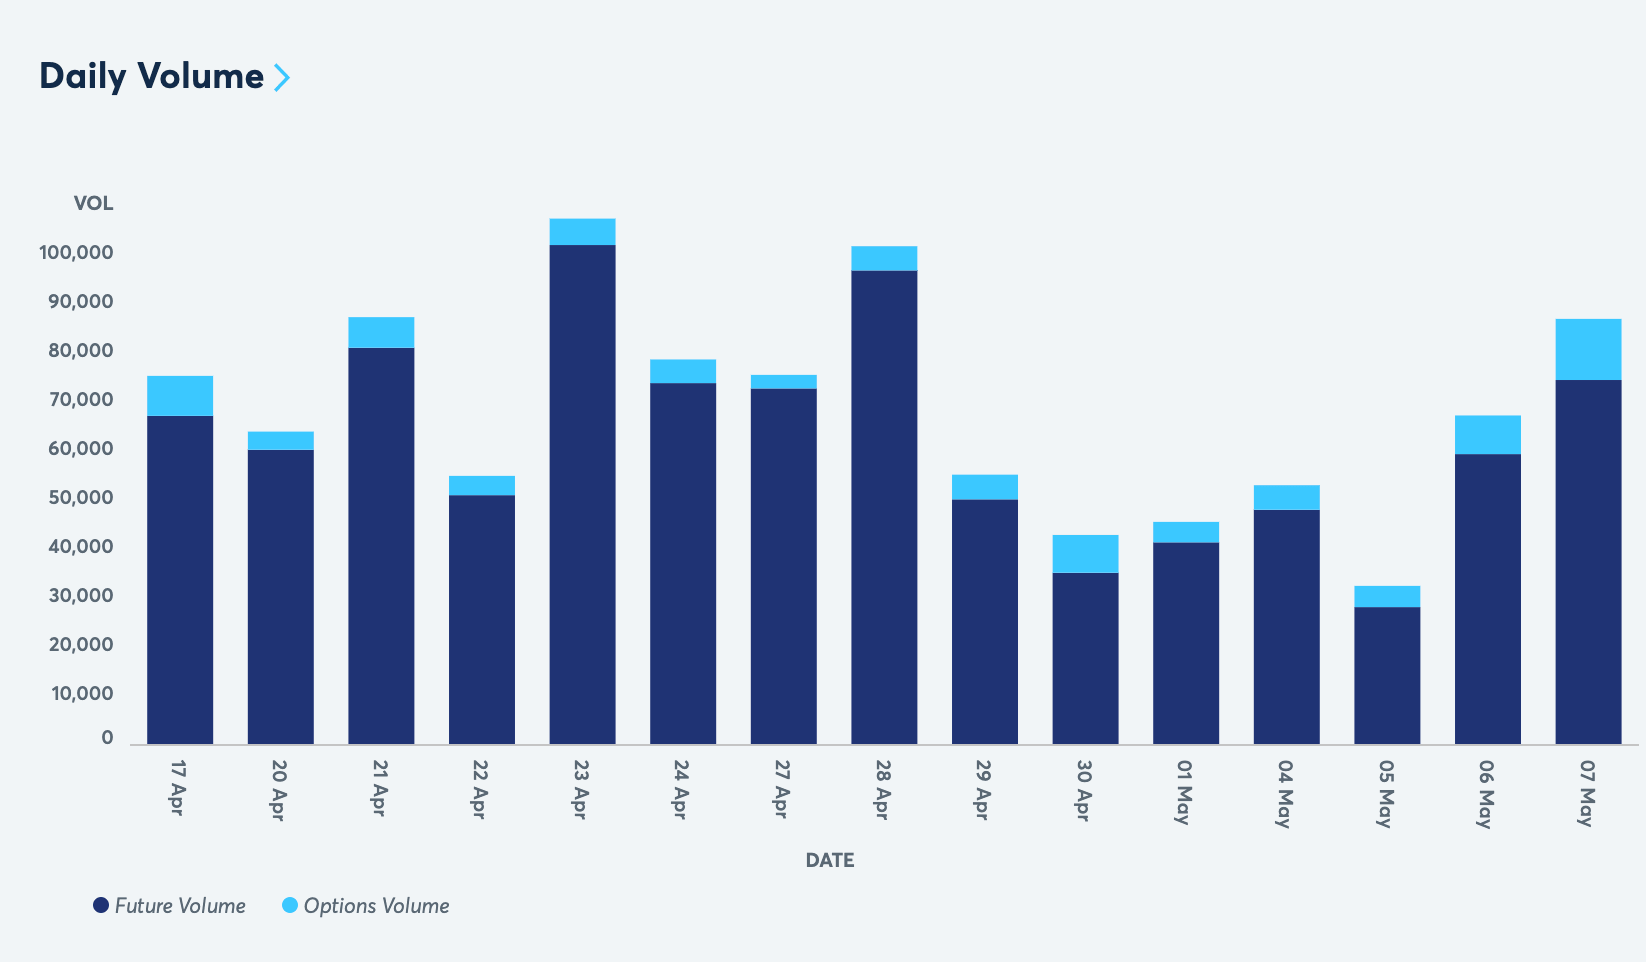
Daily volume of silver derivatives (dark blue – futures; light blue – options). Source: CME Group