S&P 500 — US Large Cap Index
 FTSE 100 — UK Blue Chips
 Euro Stoxx 50 — Eurozone Leaders
 DAX 40 — German Equities
 CAC 40 — French Market Index
 Nikkei 225 — Japan Benchmark
 Hang Seng — Hong Kong Index
 Shanghai Composite — China Mainland
 ASX 200 — Australian Market
 TSX Composite — Canada Index
 Nifty 50 — India Large Cap
 STI Index — Singapore Market
 KOSPI — South Korea Index
 Bovespa — Brazil Equities
 JSE Top 40 — South Africa Index
 IPC Index — Mexico Market

Why is crypto losing value?
Bitcoin is being driven by a confluence of factors. On the one hand, BTC is seeing this because institutions are pulling capital out of high-risk assets amid tightening financial conditions and the Fed’s hawkish policy.
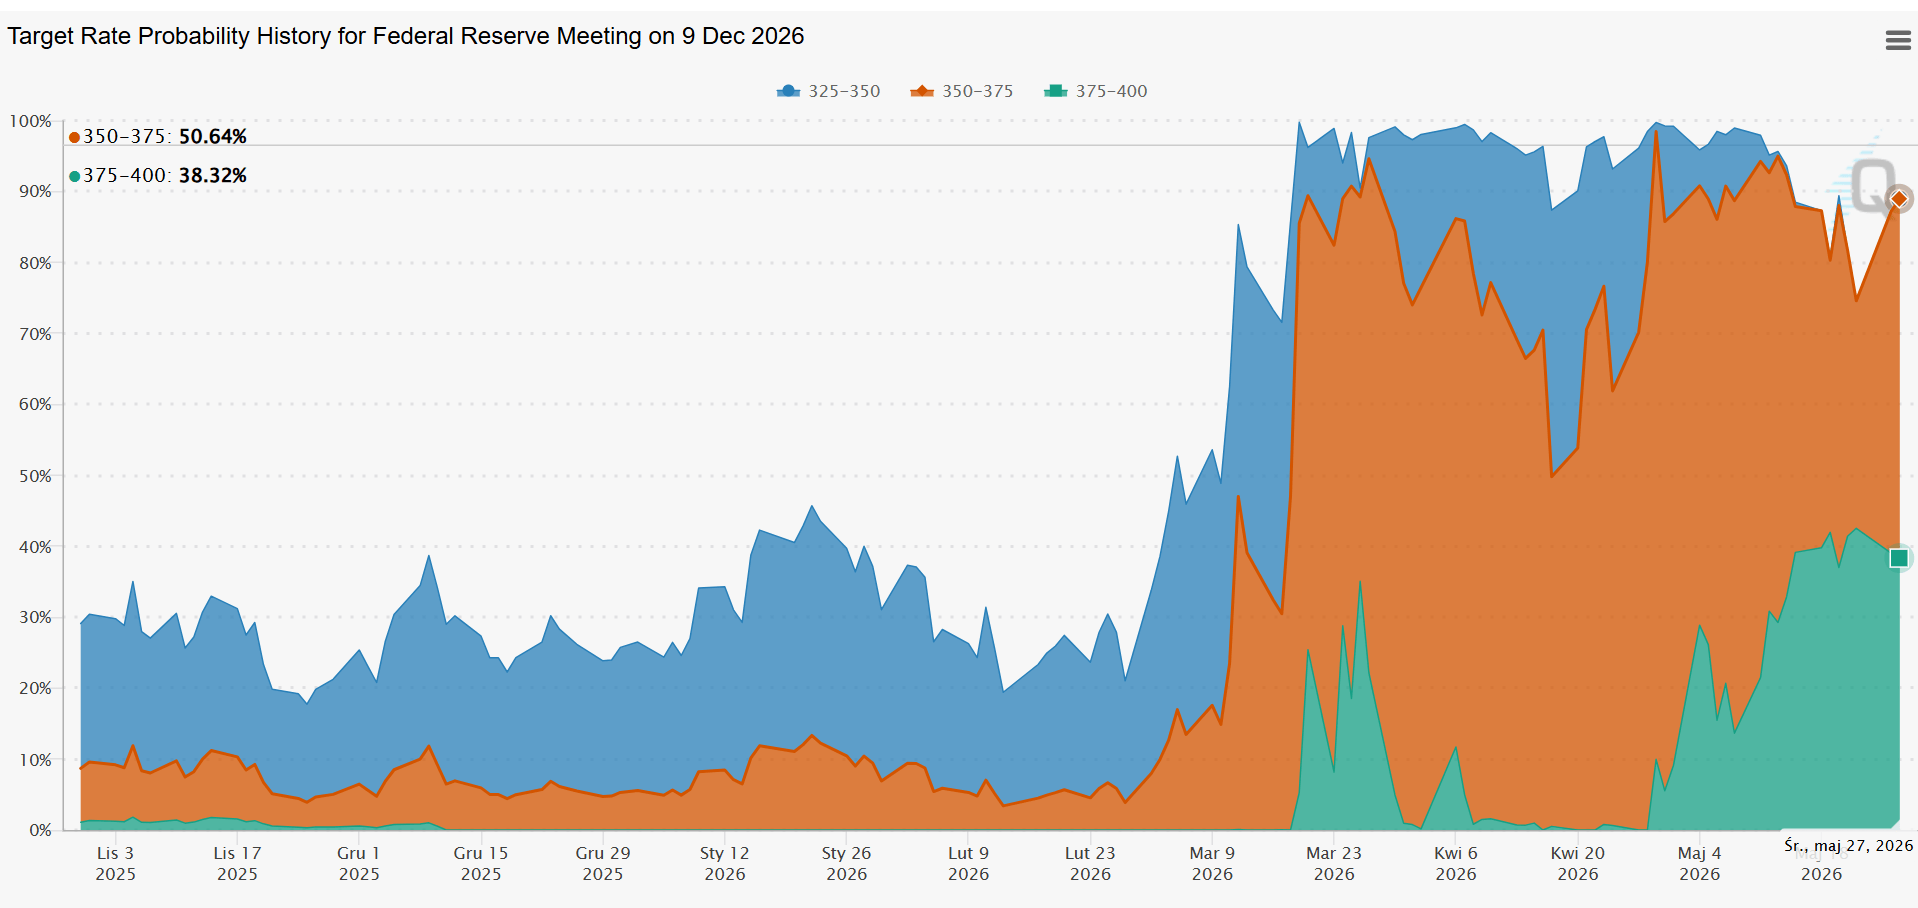
Until recently, the market had expected the Fed to cut rates in 2026. Now, in the wake of the conflict in the Middle East, that scenario seems completely unrealistic, and the odds have even shifted in favor of rate hikes. The current rate remains in the 350-375 bp range. Source: FED Watch Tool
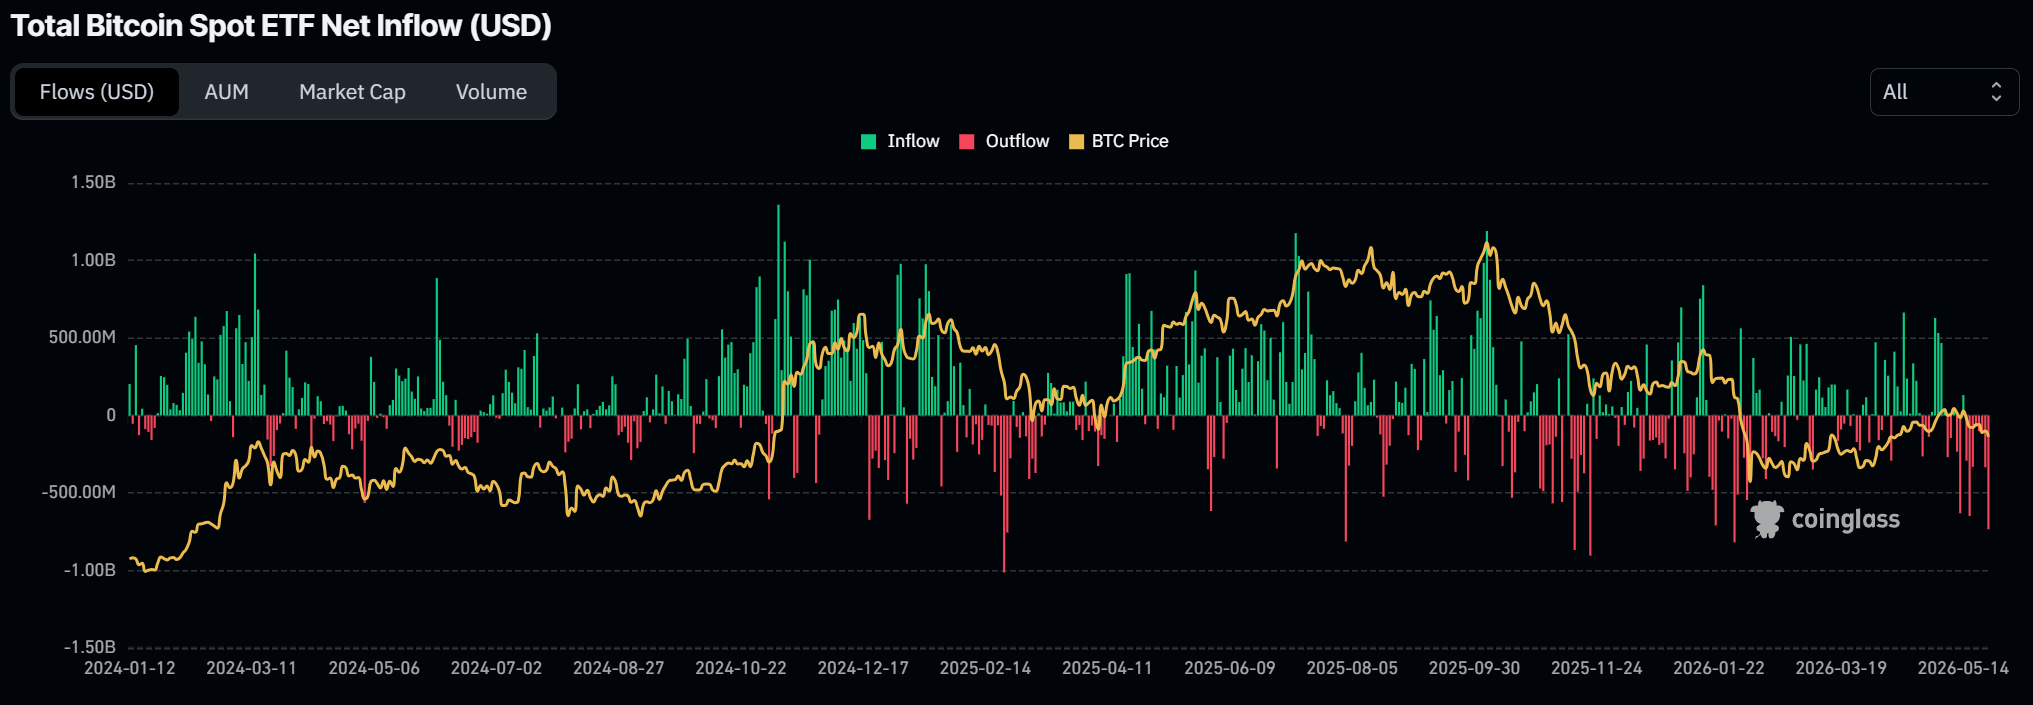
What’s more, over the past few days, there has been a sharp increase in capital outflows from spot BTC funds. Source: Coinglass
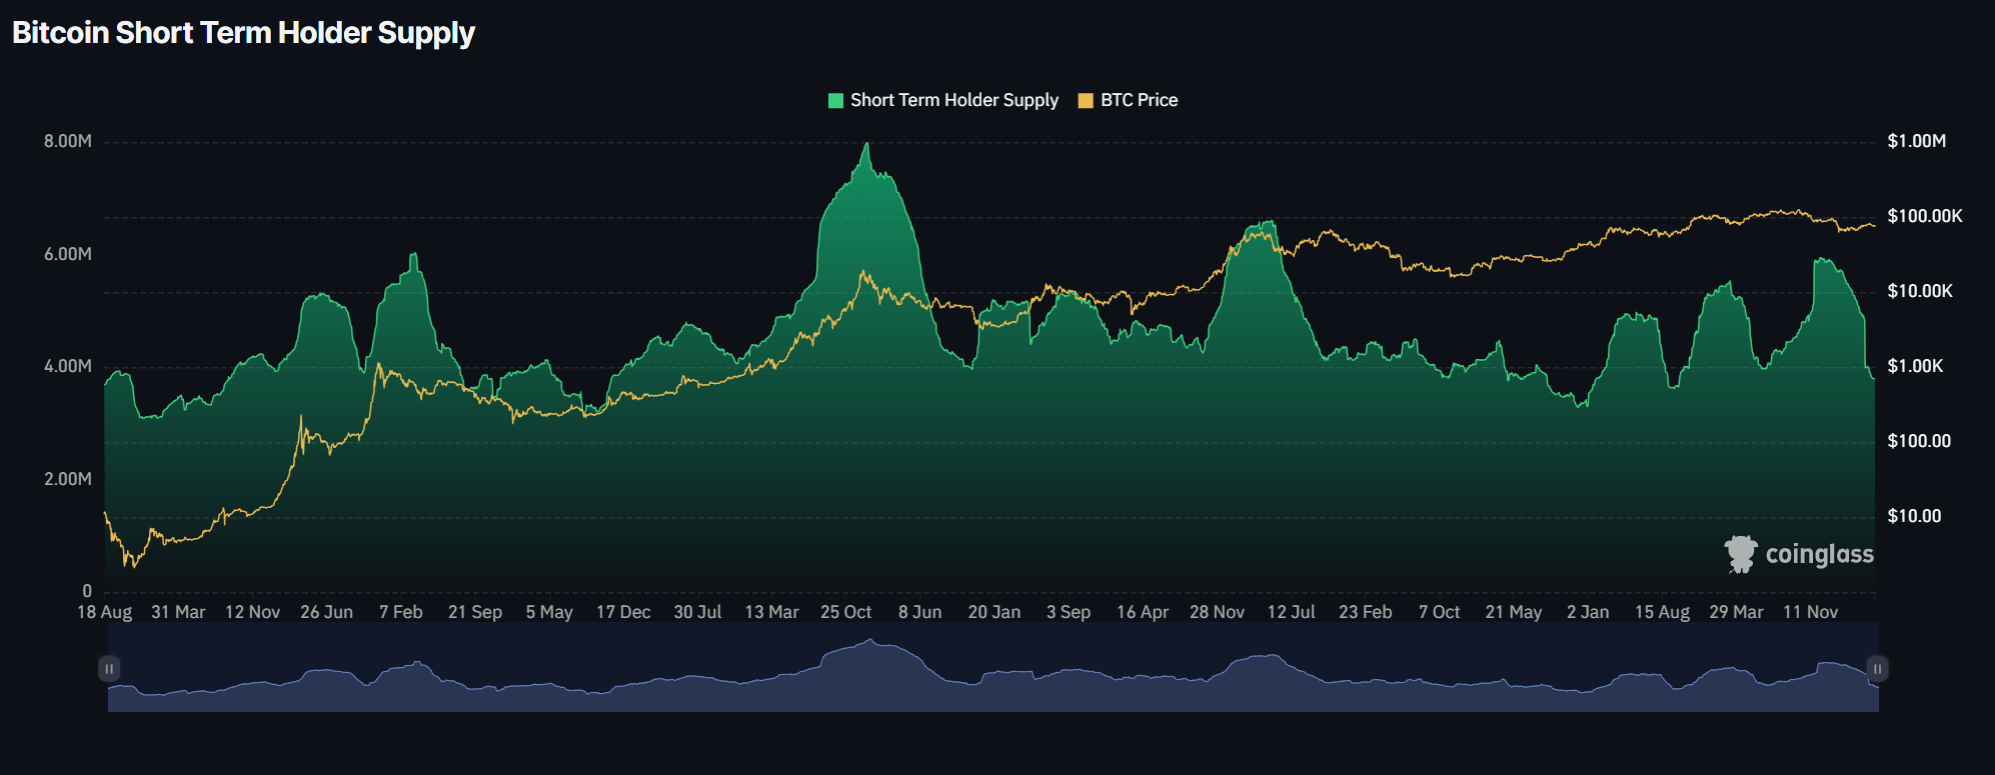
What’s more, short-term holders continue to liquidate their positions, flooding the market with hundreds of thousands of BTC, which creates structural supply pressure, although long-term investors seem to be doing the opposite. Source: Coinglass Bitcoin – Technical Analysis
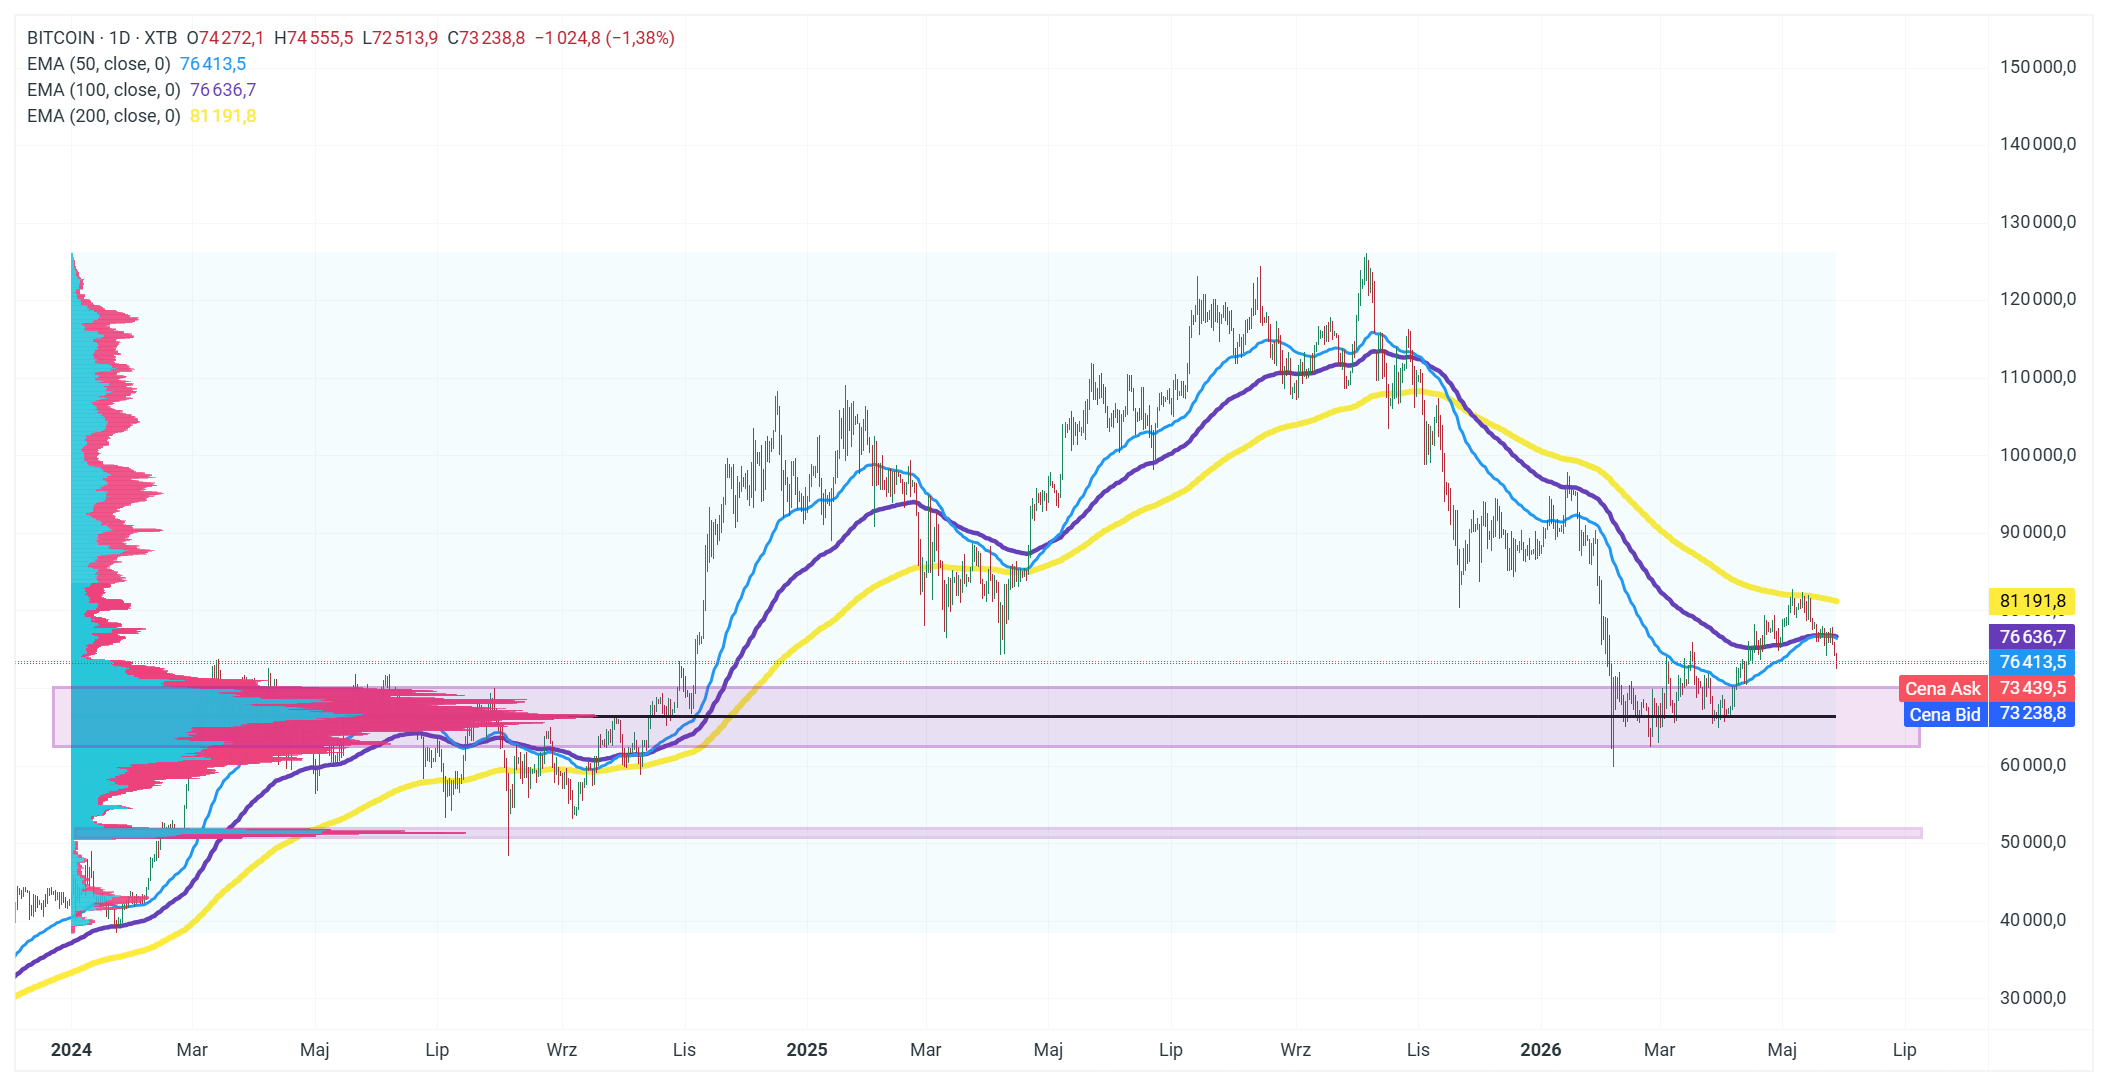
EMA structure — bearish signal
Three key exponential moving averages clearly point to a bear market. The EMA50 (blue) stands at 76,413, the EMA100 (purple) at 76,636, and the EMA200 (yellow) as high as 81,191. The price is clearly moving below all three moving averages , which have formed a “death cross”—each subsequent EMA is above the previous one, and the price is stuck below all of them. This is a classic configuration confirming supply pressure.
Support levels and volume (Volume Profile)
The volume profile (VAH on the left) indicates that the highest concentration of historical transactions occurred in the range of approximately $50,000–$75,000 , which explains why this level acts as a magnet for the price. A broad horizontal support zone marked on the chart around $73,000–$76,000 (pink rectangle), and below it another, stronger zone in the region of $50,000–$55,000 (purple rectangle). The thick black horizontal line (~$74,000) is the previous Value Area. If the price remains below the 50-day and 100-day EMAs and continues to bounce off these levels, it could open the way to support in the $60,000–$63,000 range. A bullish recovery would require a break above and a close above the 200-day EMA at ~$81,000.